Unveiling the colorful evolution: The history of LEGO blocks’ color expansion
In 2019, I redesigned and shippted the unfied checkout experiecne across 102 countries where Huawei was selling their digital products (Laptops, phones, and other accessories).
Roles & Responsibilities
Team of 2
Research
Data cleaning
Data visualization
Roles & Responsibilities
3 weeks

Exploring the evolution of LEGO
Utilizing Tableau, we crafted visualizations to delve into the intricate world of LEGO sets. I was the main contributor of our final visual dashboard delivery.
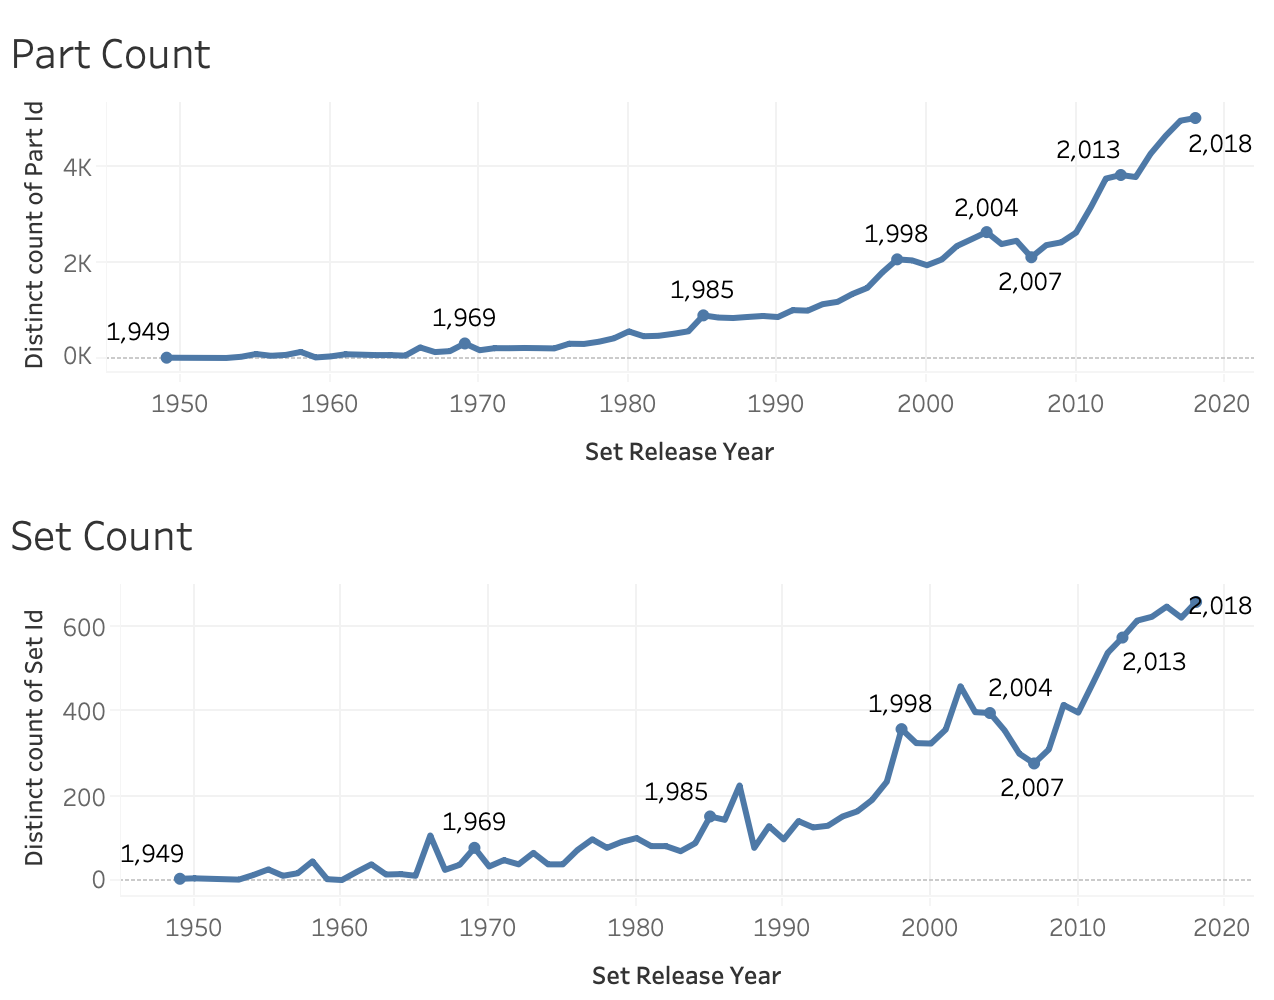
Rise in LEGO Complexity
Our analysis reveals a notable increase in the number of LEGO parts over time, indicating a trend towards greater complexity and specialization. The upward trajectory in part count and set count illustrates the evolving landscape of LEGO construction. However, a curious decline in LEGO production in 2007 prompts investigation, uncovering economic factors that led to outsourcing production to external partners.
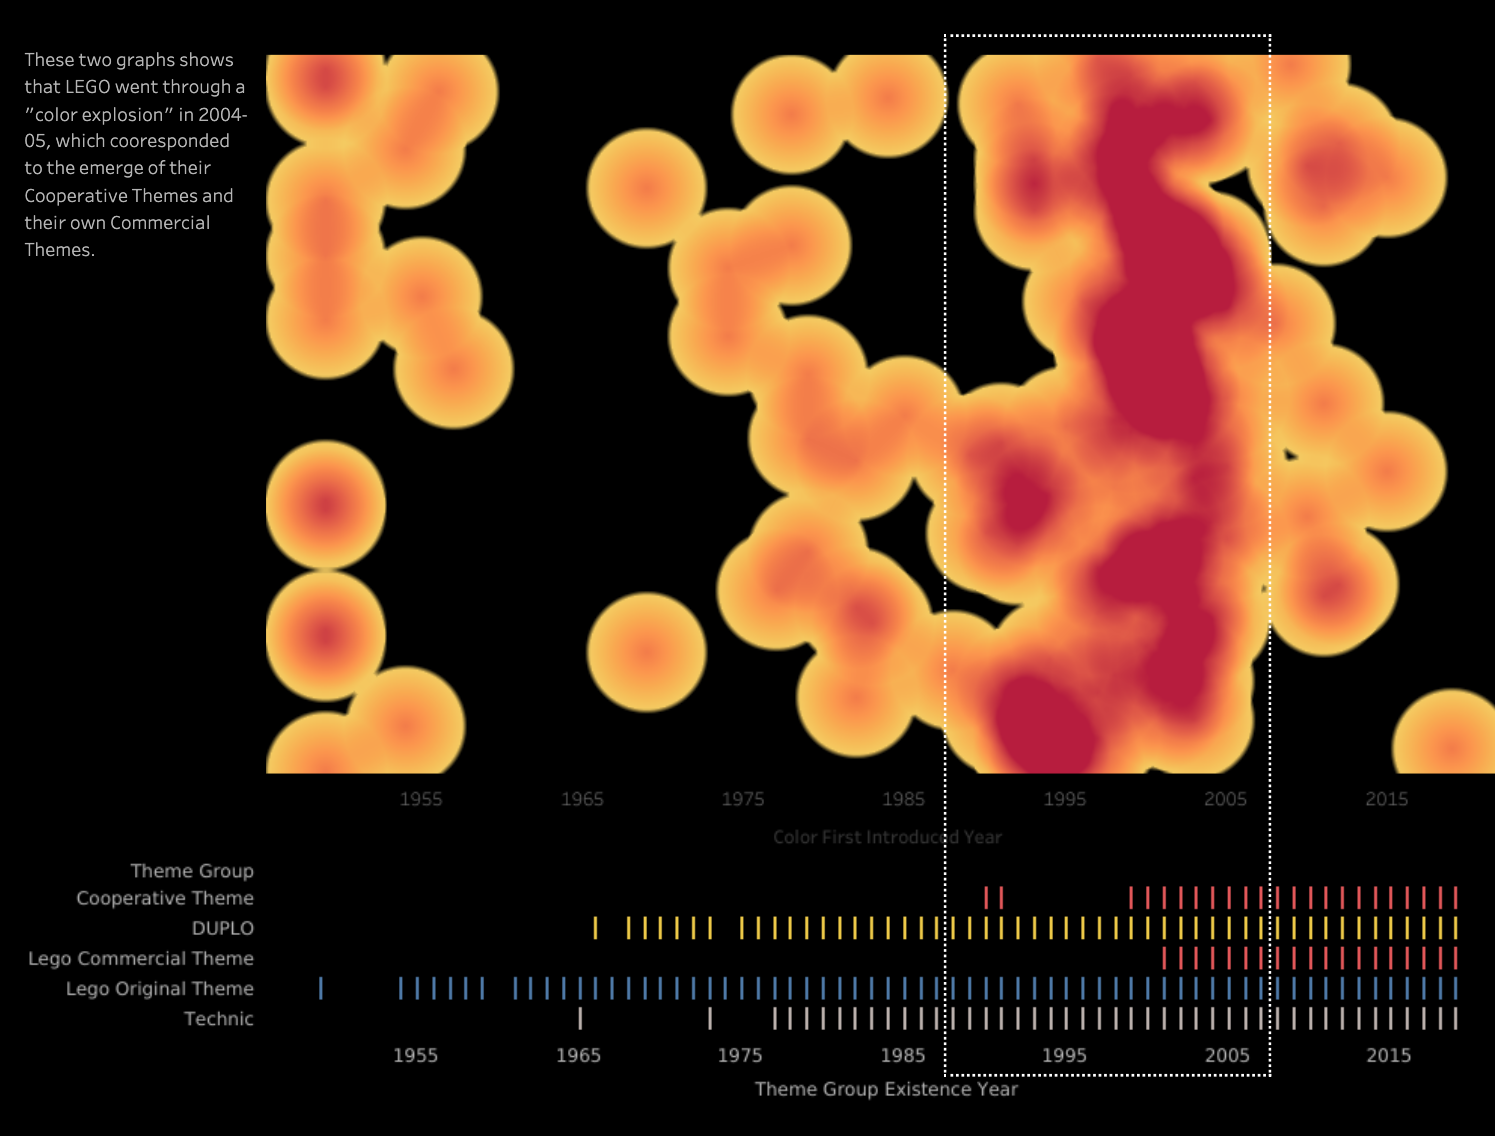
Color Explosion and Theme Expansion
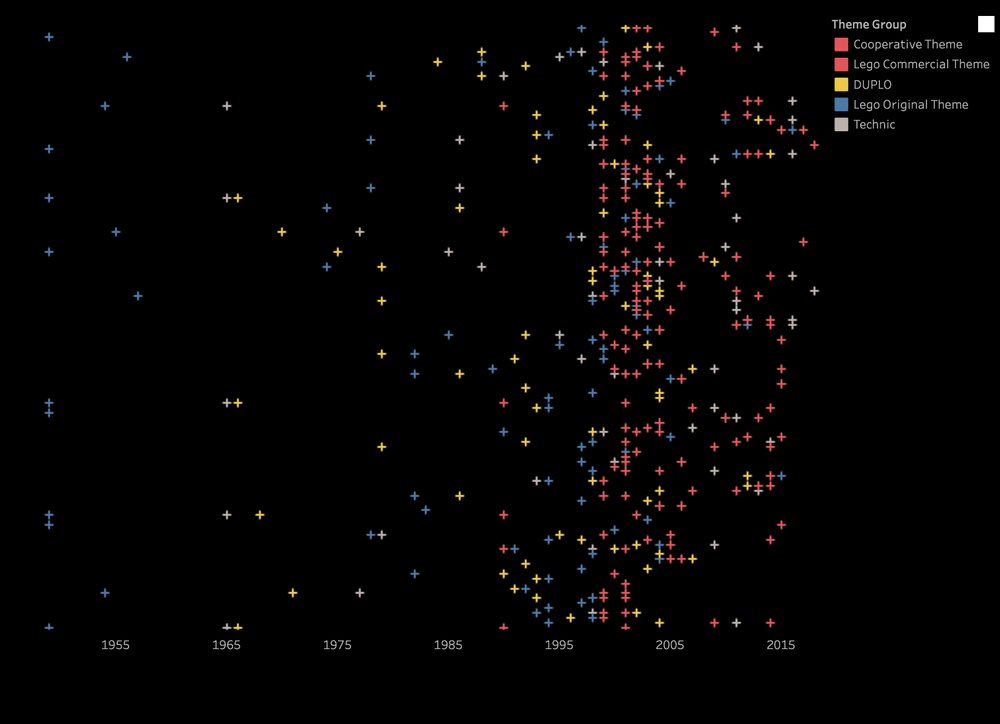
A visual exploration (density map) unveils a "color explosion" in 2004-2005, reflecting the emergence of more intricate and commercially themed LEGO sets. Commercial themes have witnessed significant expansion, as depicted by the proportion of different theme groups. Moreover, the introduction of new colors, particularly for commercial themes, underscores LEGO's continuous innovation and response to market demands.
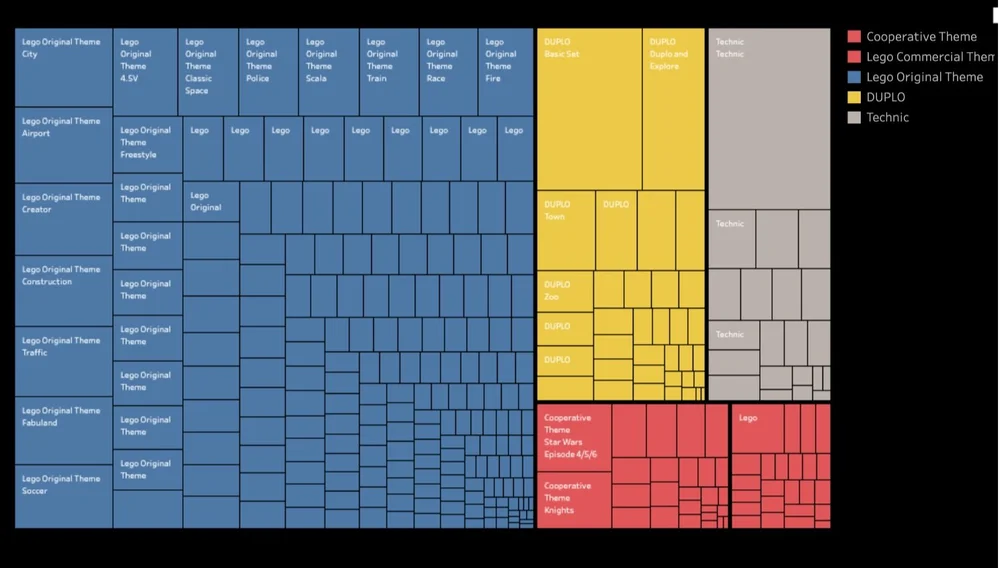
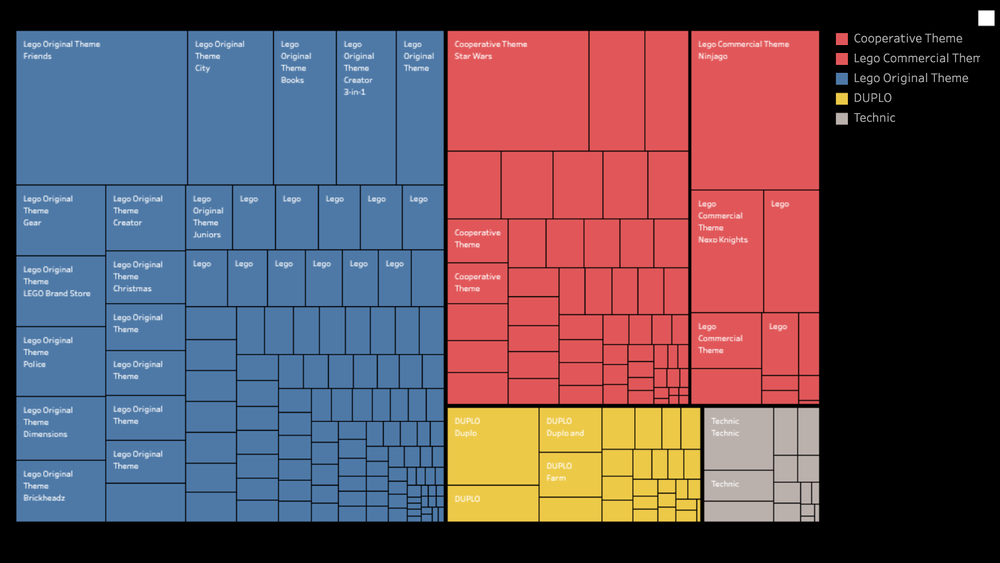
After we had the insights of Lego’s commercial themes was increased significantly, I decided to build 2 tree map to better show the ratio of Lego’s each themes. In the below 2 tree maps, the proportion of different theme groups over all themes is put into perspective. It’s apparent by the relative size and color that commercial themes have expanded most rapidly. (Red indicates Lego’s commercial theme)
Proportion of Themes before 2010
Proportion of Themes after 2010
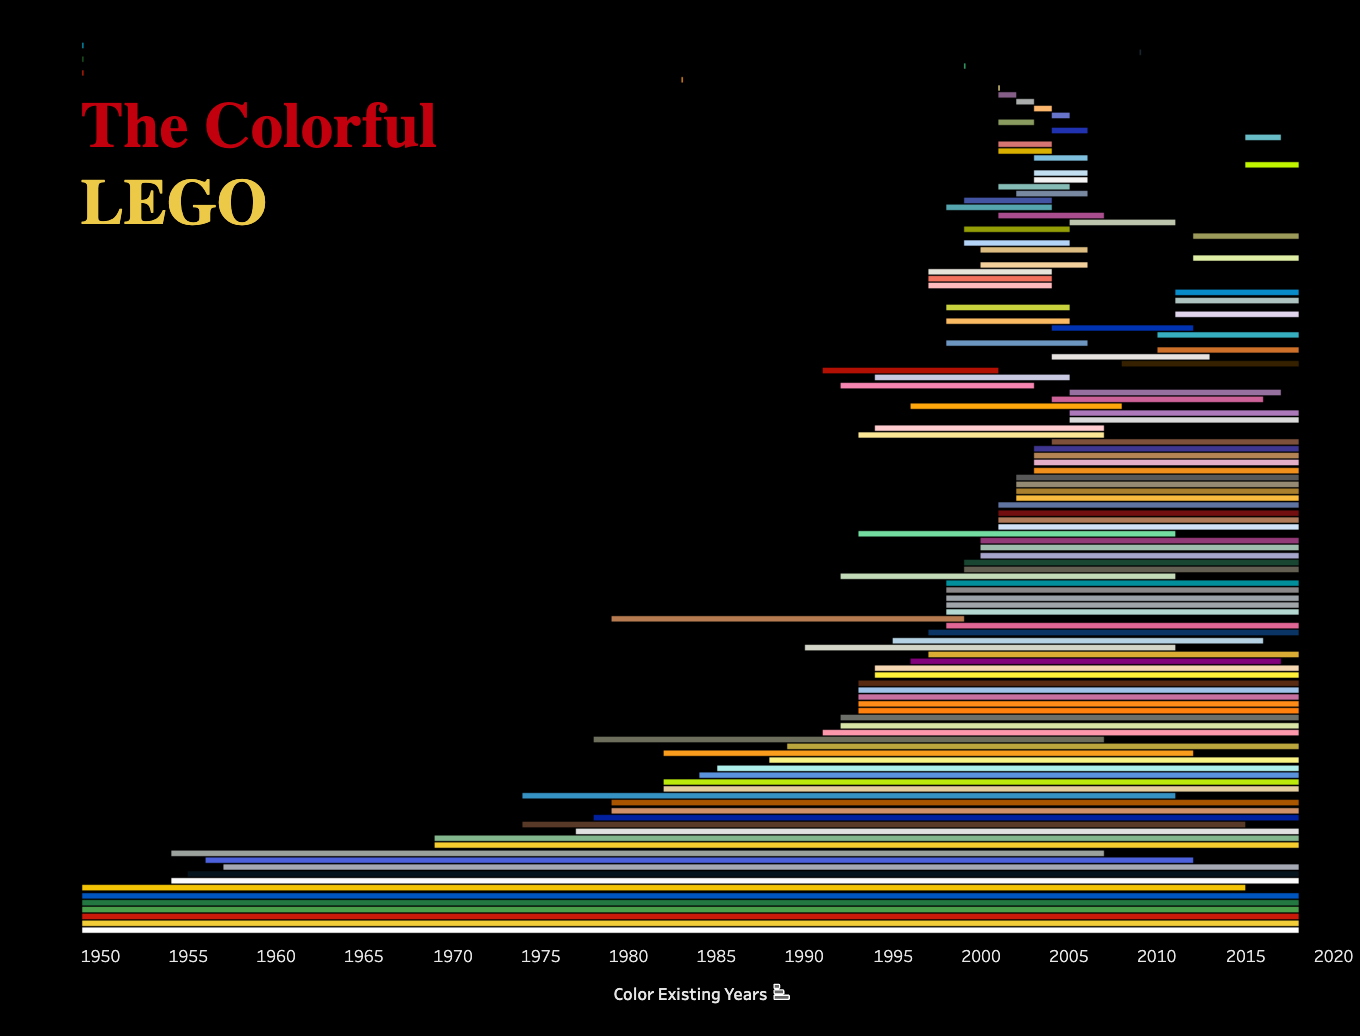
Evolution of pallete
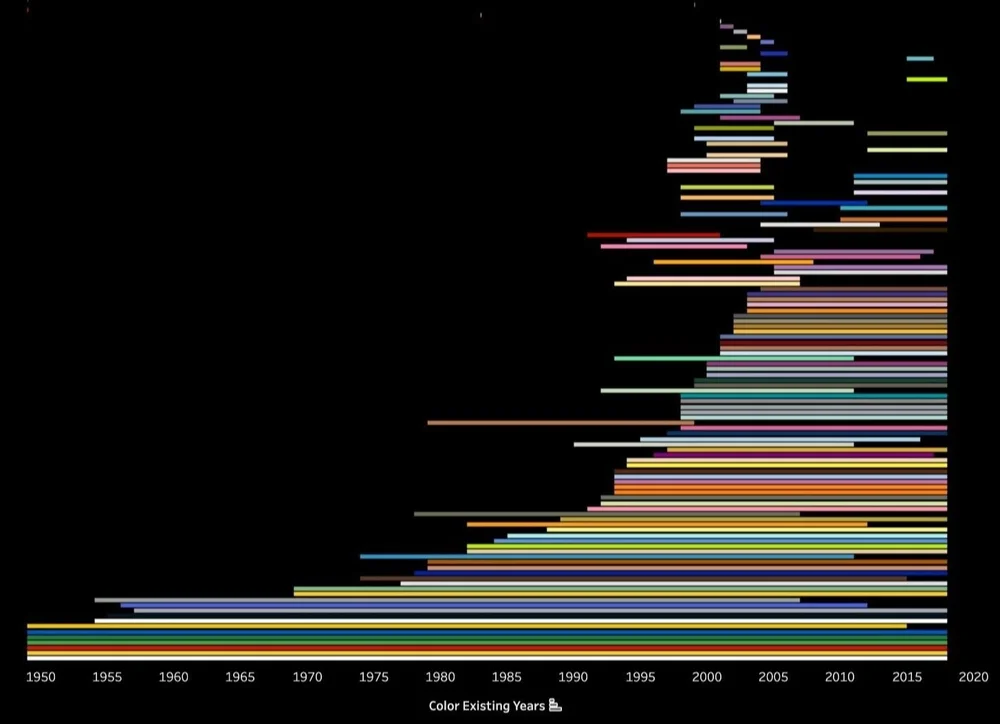
Our analysis also focused on the evolution of LEGO’s color palette over time. I create following 2 grahs to illustrate this evolution, revealing a steady increase in the number of colors introduced. From the 1st graph, we observed the colors intorduced later in the decade had shorter lifespans compared to earlier introductions. From the 2nd graph, we noticed the majority of new colors were developed for commercial themes, highlighting LEGO's strategic approach to product innovation and differentiation.
Color Introduction over Years
Color Count Based on Theme Groups
Evolution of pallete
A further analysis was conducted based on LEGO’s special pieces, particular focusing on the relationship between mini-figures and special themes. I designed the below combined graphs to show the trend that underscores LEGO's commitment to catering to diverse user preferences and enhancing the immersive experience of LEGO building.
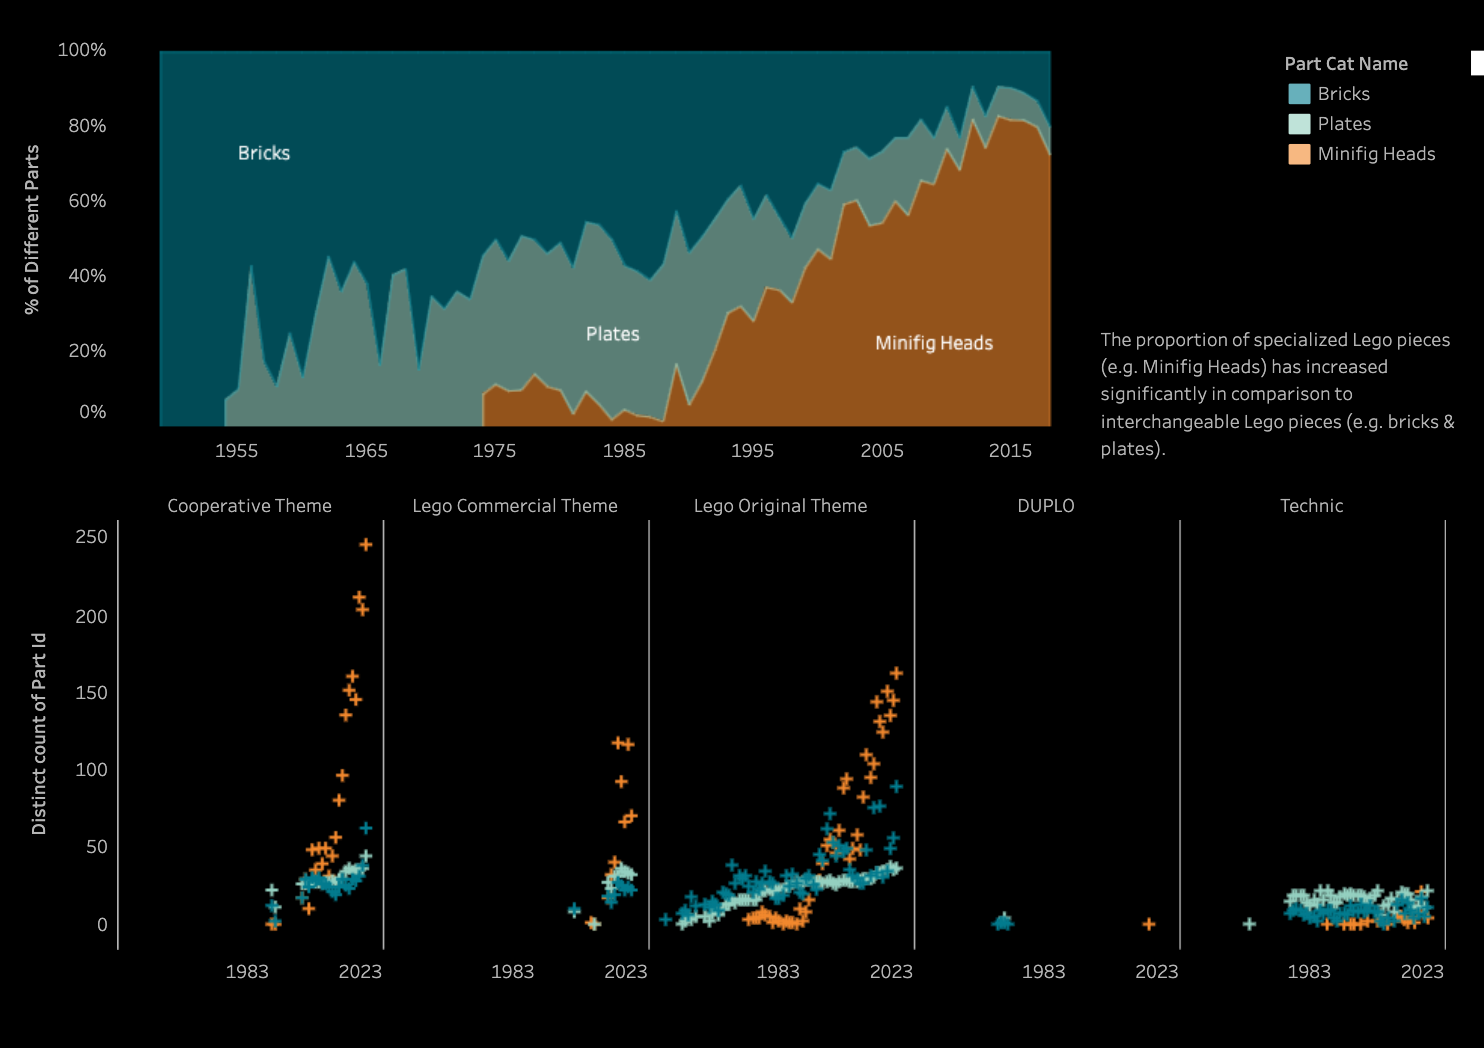
Specialization of Lego Parts Over Time
Evolution of pallete
The final visualization marked the complex nature of each major LEGO theme through a dynamic color count representation. This visual depiction offers insights into the thematic diversity and intricacies inherent in LEGO constructions, providing a comprehensive overview of LEGO's thematic evolution over time. The final delivery is an interactive dashboard, I put together a video forma tin order to better show the experience.
Process and data source
I led the research workshops for this project to define the scope and direction. Based on the data sources I found, I managed to compile raw data sets for my teammates to process and further clean.
Evolution of pallete
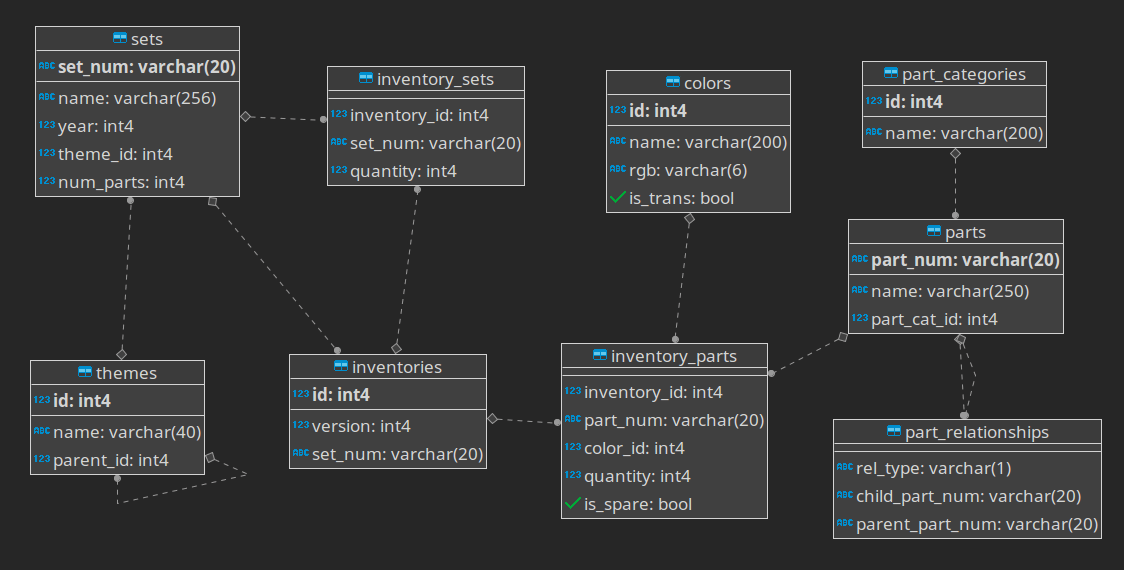
This project relies on two Lego datasets sourced from a LEGO fan website called Rebrickable. The primary database we utilized features a comprehensive schema and is regularly updated on a monthly basis. It encompasses detailed information on "The LEGO Parts/Sets/Colors and Inventories of every official LEGO set." This extensive database is organized into different datasets, as depicted in the schema below.
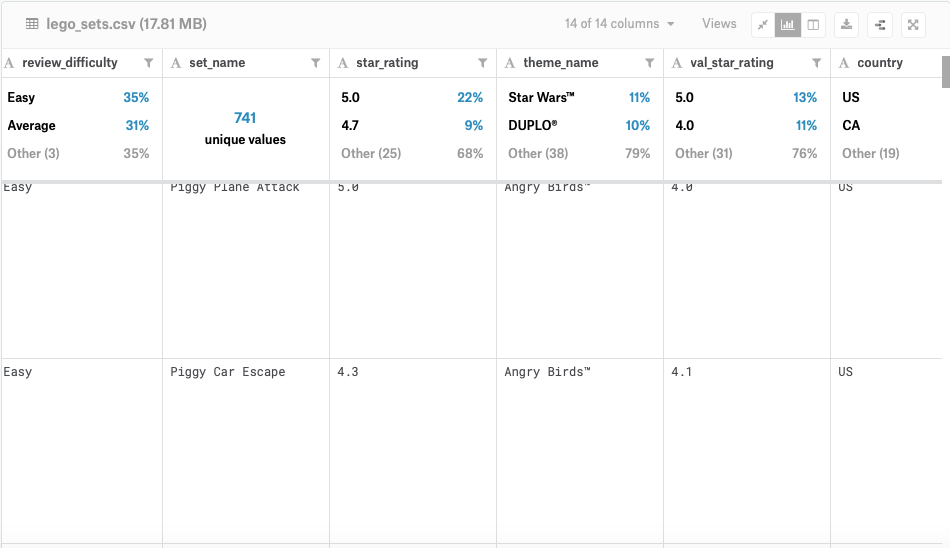
The second dataset was obtained from the Kaggle website. It offers a wealth of user-centered content, including reviews, prices, ratings, and difficulty levels. This dataset enriches our analysis by providing valuable insights into the user experience (UX) aspect of LEGO products.
With a nice and organized foundation, we moved on to the next step - data cleaning - identifying and understanding the relationships among these datasets.
Unveiling the colorful evolution: The history of LEGO blocks’ color expansion
Lego, a globally recognized brand, has evolved from its humble origins to become one of the most beloved toys worldwide. Renowned for its colorful interlocking bricks, Lego offers endless possibilities for creativity and construction, appealing to both young and experienced users.
In this study, we delve into the multifaceted nature of Lego bricks, exploring their interrelations across different sets. Our investigation aims to address key questions: How has the production rate of Lego pieces changed over time? How does the specialization of Lego sets manifest in color intricacy? How have Lego themes evolved and which ones have gained popularity?
Role & Responsibilities
Team of 2
Research
Data cleaning
Data visualization
Timeline
3 weeks

Exploring the evolution of LEGO
Utilizing Tableau, we crafted visualizations to delve into the intricate world of LEGO sets. I was the main contributor of our final visual dashboard delivery.
Rise in LEGO Complexity
Our analysis reveals a notable increase in the number of LEGO parts over time, indicating a trend towards greater complexity and specialization. The upward trajectory in part count and set count illustrates the evolving landscape of LEGO construction. However, a curious decline in LEGO production in 2007 prompts investigation, uncovering economic factors that led to outsourcing production to external partners.
Color Explosion and Theme Expansion
A visual exploration (density map) unveils a "color explosion" in 2004-2005, reflecting the emergence of more intricate and commercially themed LEGO sets. Commercial themes have witnessed significant expansion, as depicted by the proportion of different theme groups. Moreover, the introduction of new colors, particularly for commercial themes, underscores LEGO's continuous innovation and response to market demands.
After we had the insights of Lego’s commercial themes was increased significantly, I decided to build 2 tree map to better show the ratio of Lego’s each themes. In the below 2 tree maps, the proportion of different theme groups over all themes is put into perspective. It’s apparent by the relative size and color that commercial themes have expanded most rapidly. (Red indicates Lego’s commercial theme)
Proportion of Themes before 2010
Proportion of Themes after 2010
Evolution of color palette
Our analysis also focused on the evolution of LEGO’s color palette over time. I create following 2 grahs to illustrate this evolution, revealing a steady increase in the number of colors introduced. From the 1st graph, we observed the colors intorduced later in the decade had shorter lifespans compared to earlier introductions. From the 2nd graph, we noticed the majority of new colors were developed for commercial themes, highlighting LEGO's strategic approach to product innovation and differentiation.
Color Introduction over Years
Color Count Based on Theme Groups
Specialization through Mini-Figures
A further analysis was conducted based on LEGO’s special pieces, particular focusing on the relationship between mini-figures and special themes. I designed the below combined graphs to show the trend that underscores LEGO's commitment to catering to diverse user preferences and enhancing the immersive experience of LEGO building.
Specialization of Lego Parts Over Time
Mapping LEGO Themes
The final visualization marked the complex nature of each major LEGO theme through a dynamic color count representation. This visual depiction offers insights into the thematic diversity and intricacies inherent in LEGO constructions, providing a comprehensive overview of LEGO's thematic evolution over time. The final delivery is an interactive dashboard, I put together a video forma tin order to better show the experience.
Process and data source
I led the research workshops for this project to define the scope and direction. Based on the data sources I found, I managed to compile raw data sets for my teammates to process and further clean.
Data source
This project relies on two Lego datasets sourced from a LEGO fan website called Rebrickable. The primary database we utilized features a comprehensive schema and is regularly updated on a monthly basis. It encompasses detailed information on "The LEGO Parts/Sets/Colors and Inventories of every official LEGO set." This extensive database is organized into different datasets, as depicted in the schema below.
The second dataset was obtained from the Kaggle website. It offers a wealth of user-centered content, including reviews, prices, ratings, and difficulty levels. This dataset enriches our analysis by providing valuable insights into the user experience (UX) aspect of LEGO products.
With a nice and organized foundation, we moved on to the next step - data cleaning - identifying and understanding the relationships among these datasets.