Scintilla - Retail analytics platform
In early 2025, I took on the lead design role for Scintilla 2.0, Walmart’s next-generation retail analytics platform. My first responsibility was to define the North Star vision for the entire data suite, setting a clear direction for how the platform should evolve. I shaped a unified experience that empowers Suppliers and Merchants to seamlessly turn insights into action, establishing the foundation and roadmap that will guide Data Ventures for the next three years.
Role
Design lead
Timeline
Dec 24’ - May 25’
Contribution
Design, Research, Strategy, Stakeholder management
Team
1 Designer, 1 Researcher, 1 PM

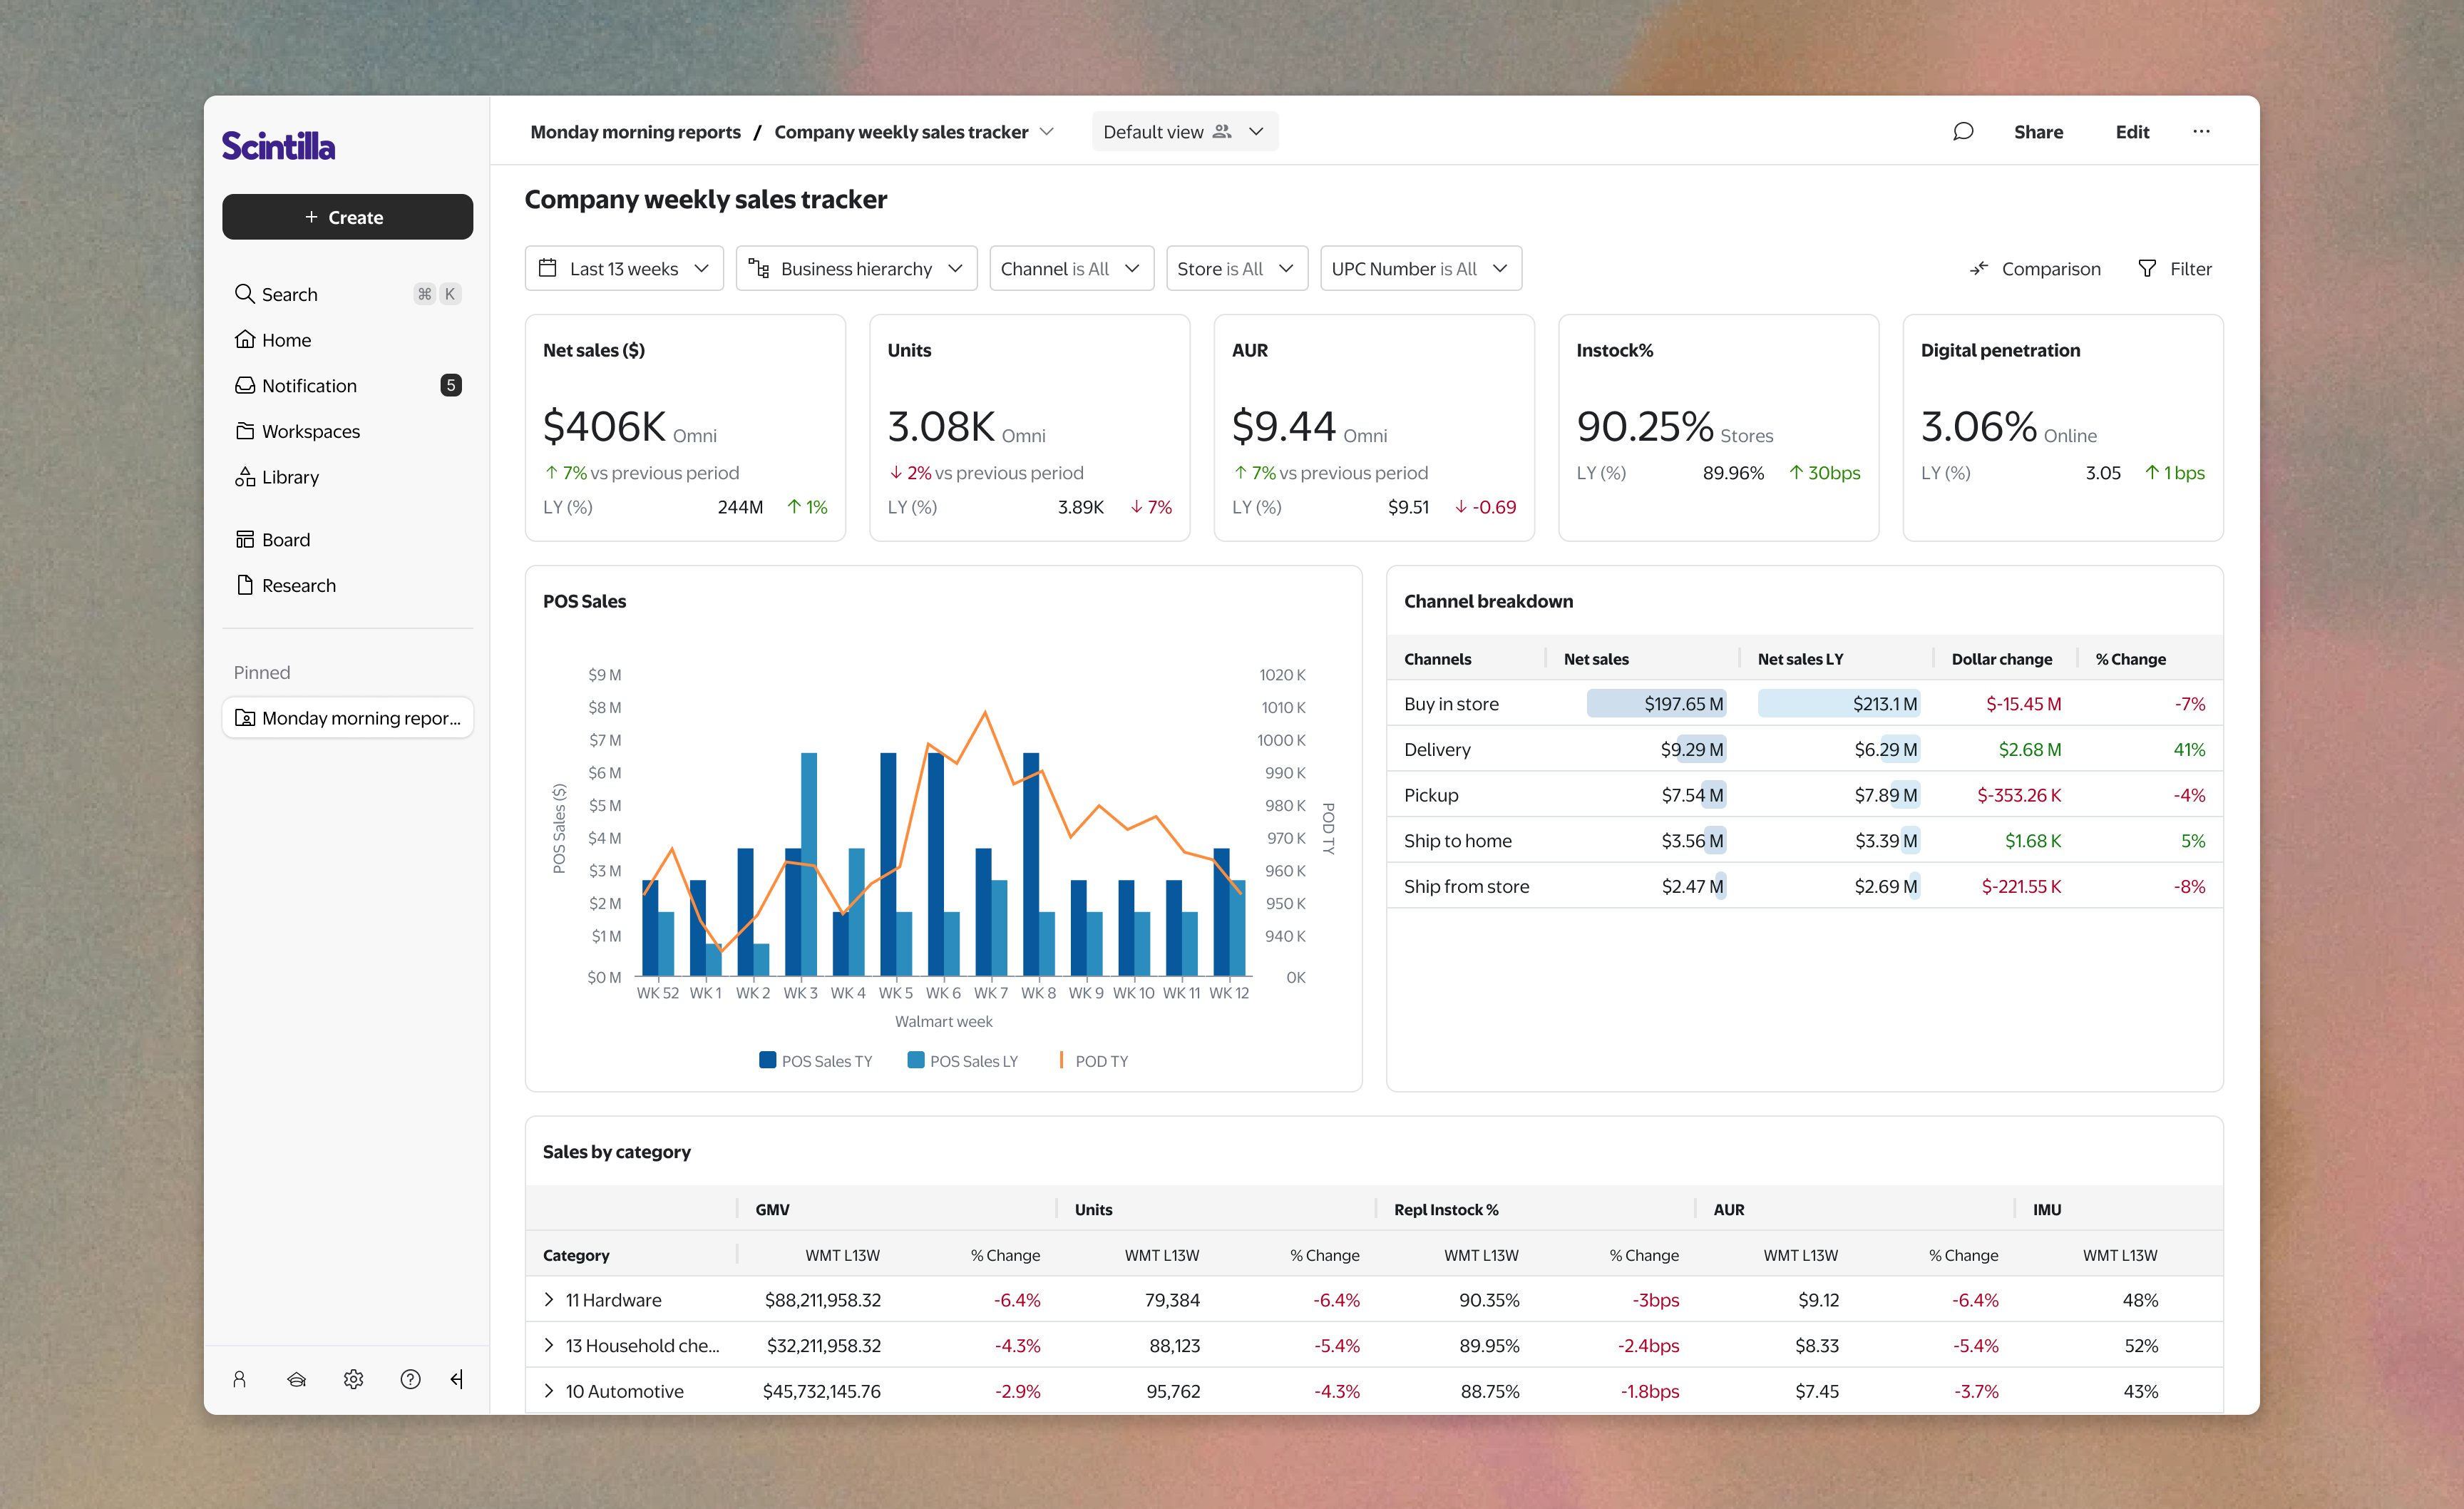
Dashboard builder
Reimagine how reports are created and data is consumed. The solution is designed for all user types, from data specialists to non-technical users, allowing seamless switching between no-code and coding modes.
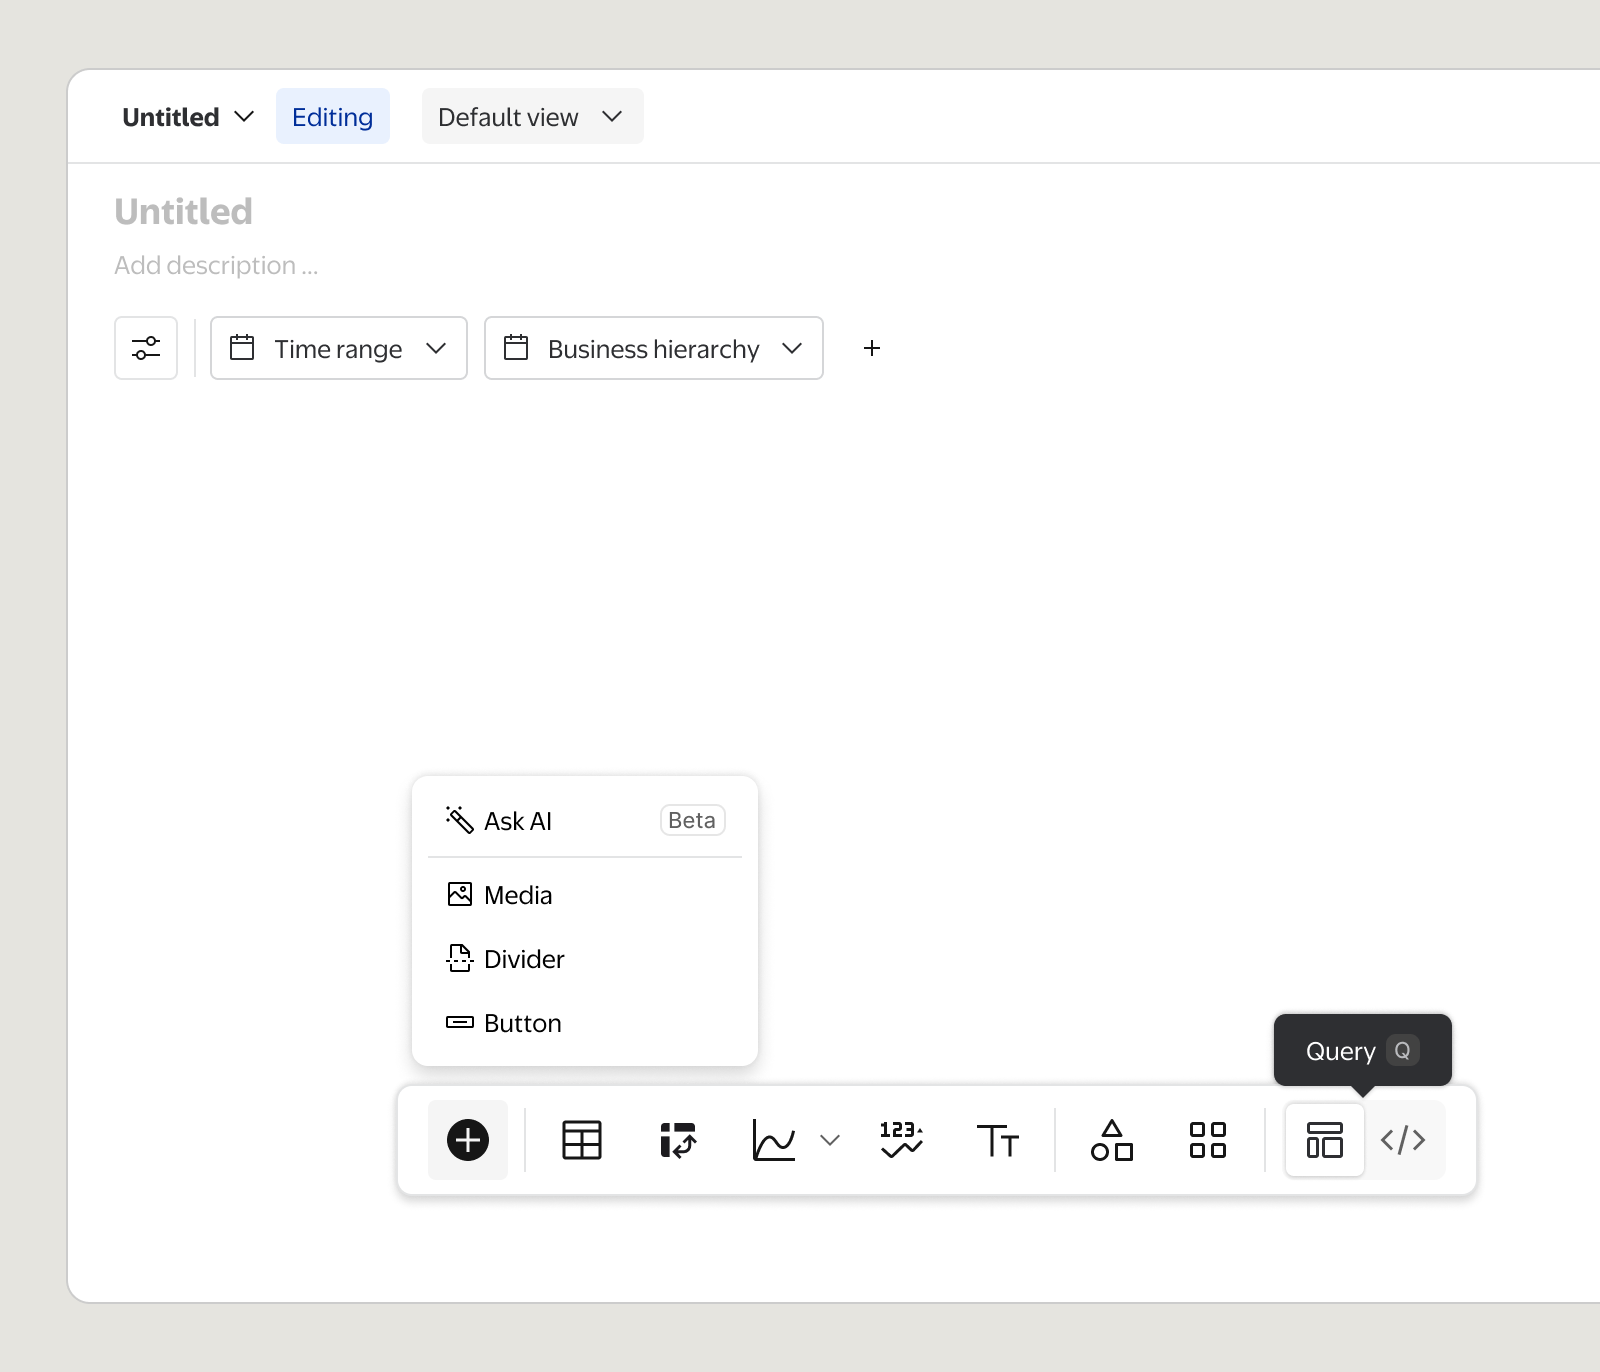
Data viz module
Building blocks for user to assemble dashboards and visualize their data.
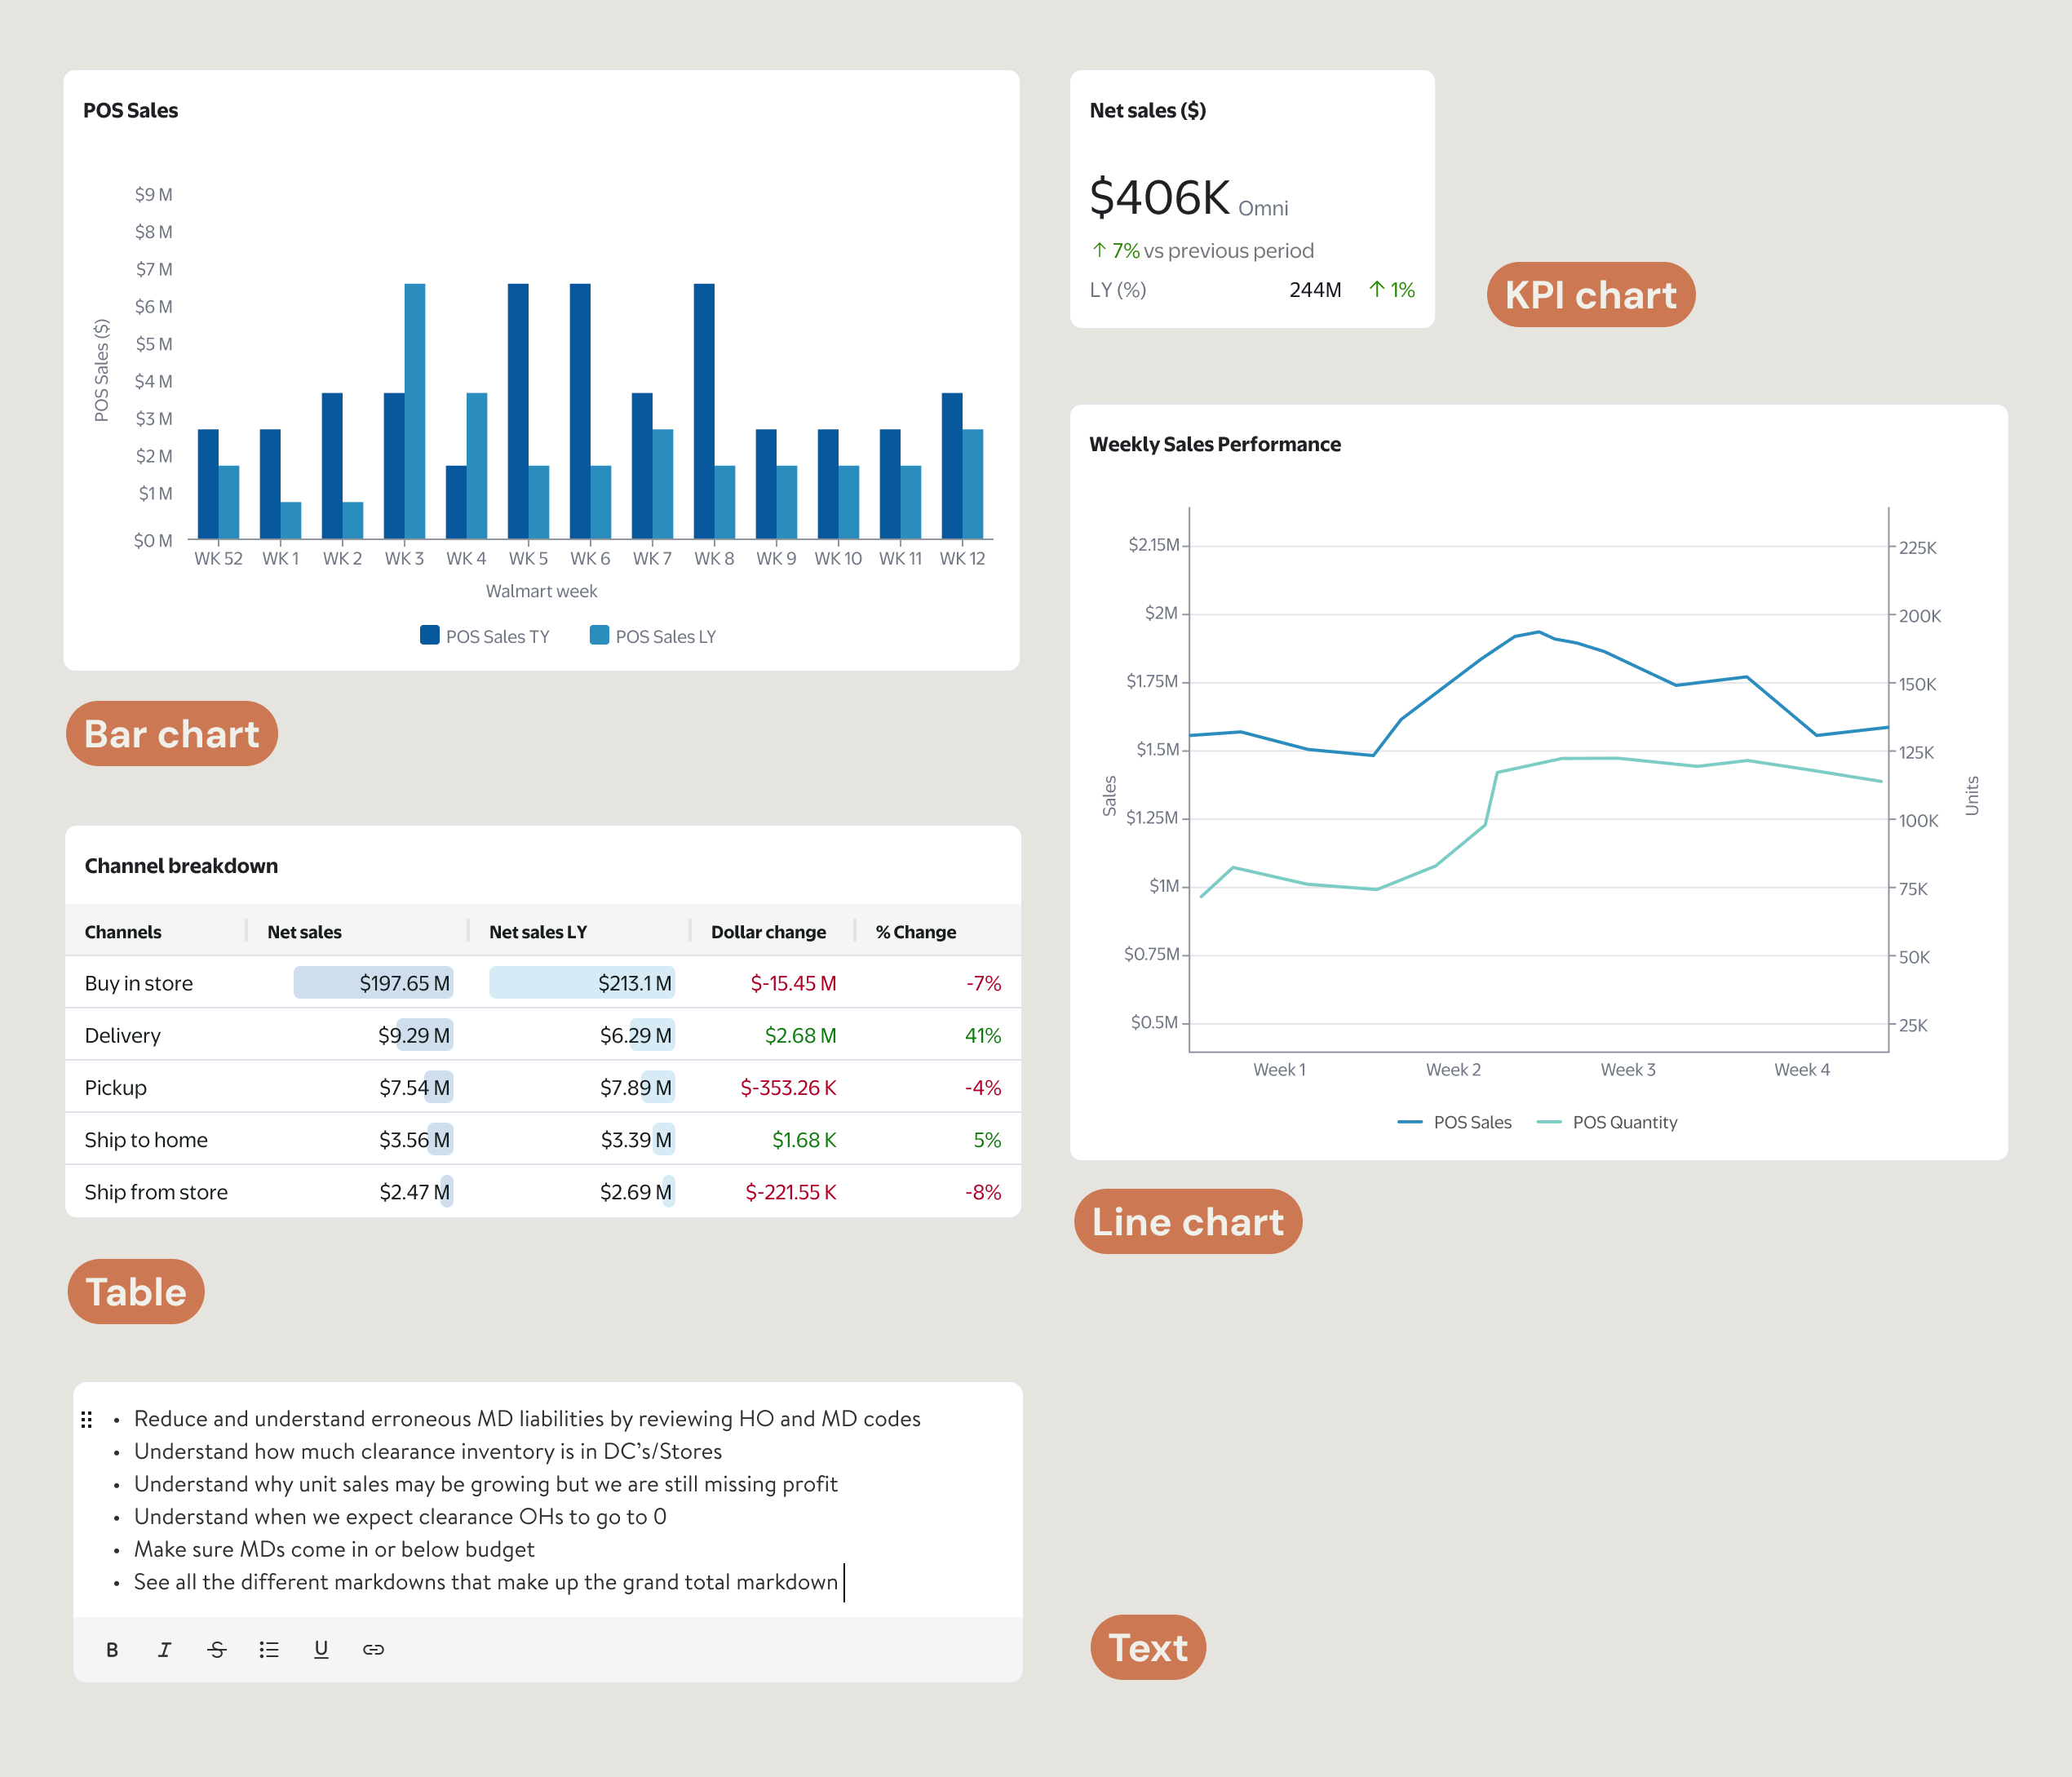
Visual type
Data can be visualized in the formats that can best present the insights.
From user interviews, we identified the five visualization types most commonly used in Supplier dashboards today.
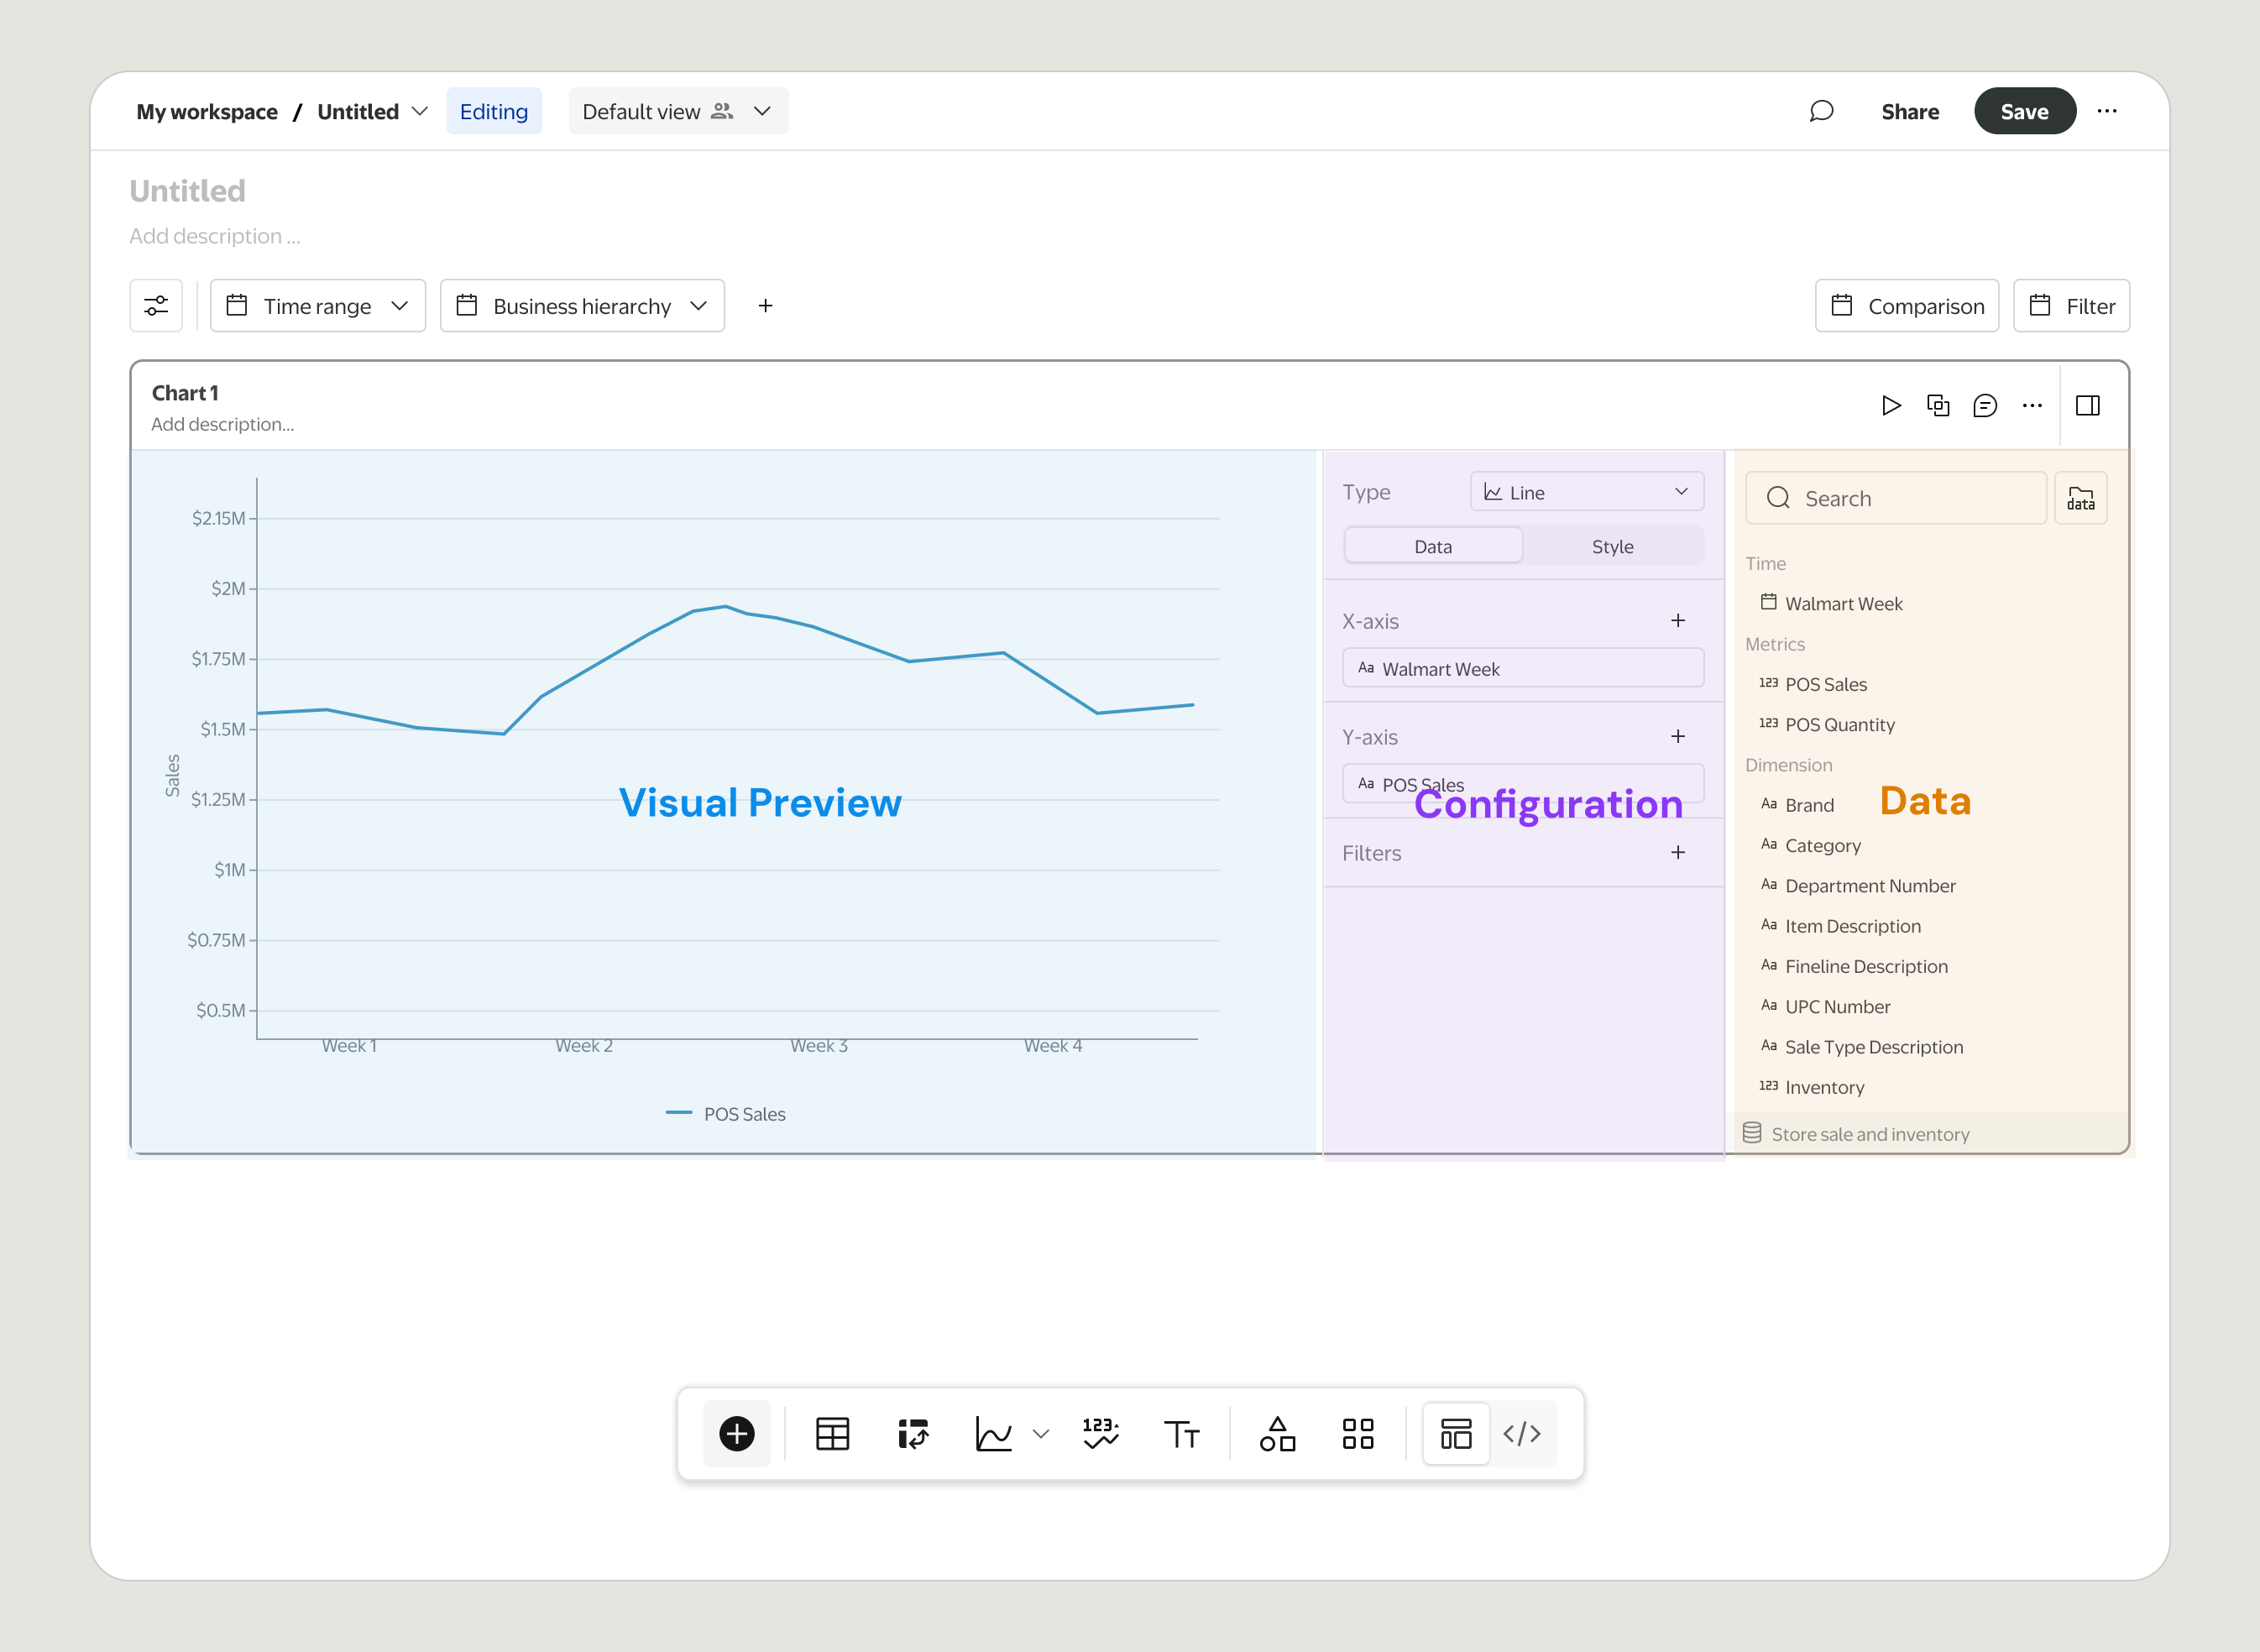
Coding mode
In contrast to above no-code dashboard creation experience, Coding mode gives technical users the flexibility to pull data through SQL, and visualize the data in Python.
Of course, they can always switch back to no-code mode via the mode switcher in the tool bar.
Sharing & Views
Dashboards can be shared across the organization. Owners and recipients can apply different filters and create saved views for flexible dashboard experiences.
All 30+ users interviewed found the system significantly easier to use than the current product. Average ease-of-use rating is 7.8/10.
100% buy in from leadership (VP of Data Ventures and Head of all cross functional teams), and the Northstar direction drove a product team re-org and business pivot.
🗣️ Let’s hear what our users said during the testings...
Please reach out if you'd like to learn more
Scintilla - Retail analytics platform
In early 2025, I took on the lead design role for Scintilla 2.0, Walmart’s next-generation retail analytics platform. My first responsibility was to define the North Star vision for the entire data suite, setting a clear direction for how the platform should evolve. I shaped a unified experience that empowers Suppliers and Merchants to seamlessly turn insights into action, establishing the foundation and roadmap that will guide Data Ventures for the next three years.
Role
Design lead
Timeline
Dec 24’ - May 25’
Contribution
Design, Research, Strategy, Stakeholder management
Team
1 Designer, 1 Researcher, 1 PM

Core system- Dashboard builder
The foundation of Scintilla 2.0 is a flexible dashboarding system that empowers both technical and non-technical users to create, customize, and share insights. It also provides a framework for scaling reusable templates, making it easier to stand up new solutions quickly.
Dashboard builder
Reimagine how reports are created and data is consumed. The solution is designed for all user types, from data specialists to non-technical users, allowing seamless switching between no-code and coding modes.
Data viz module
Building blocks for user to assemble dashboards and visualize their data.
Visual type
Data can be visualized in the formats that can best present the insights.
From user interviews, we identified the five visualization types most commonly used in Supplier dashboards today.
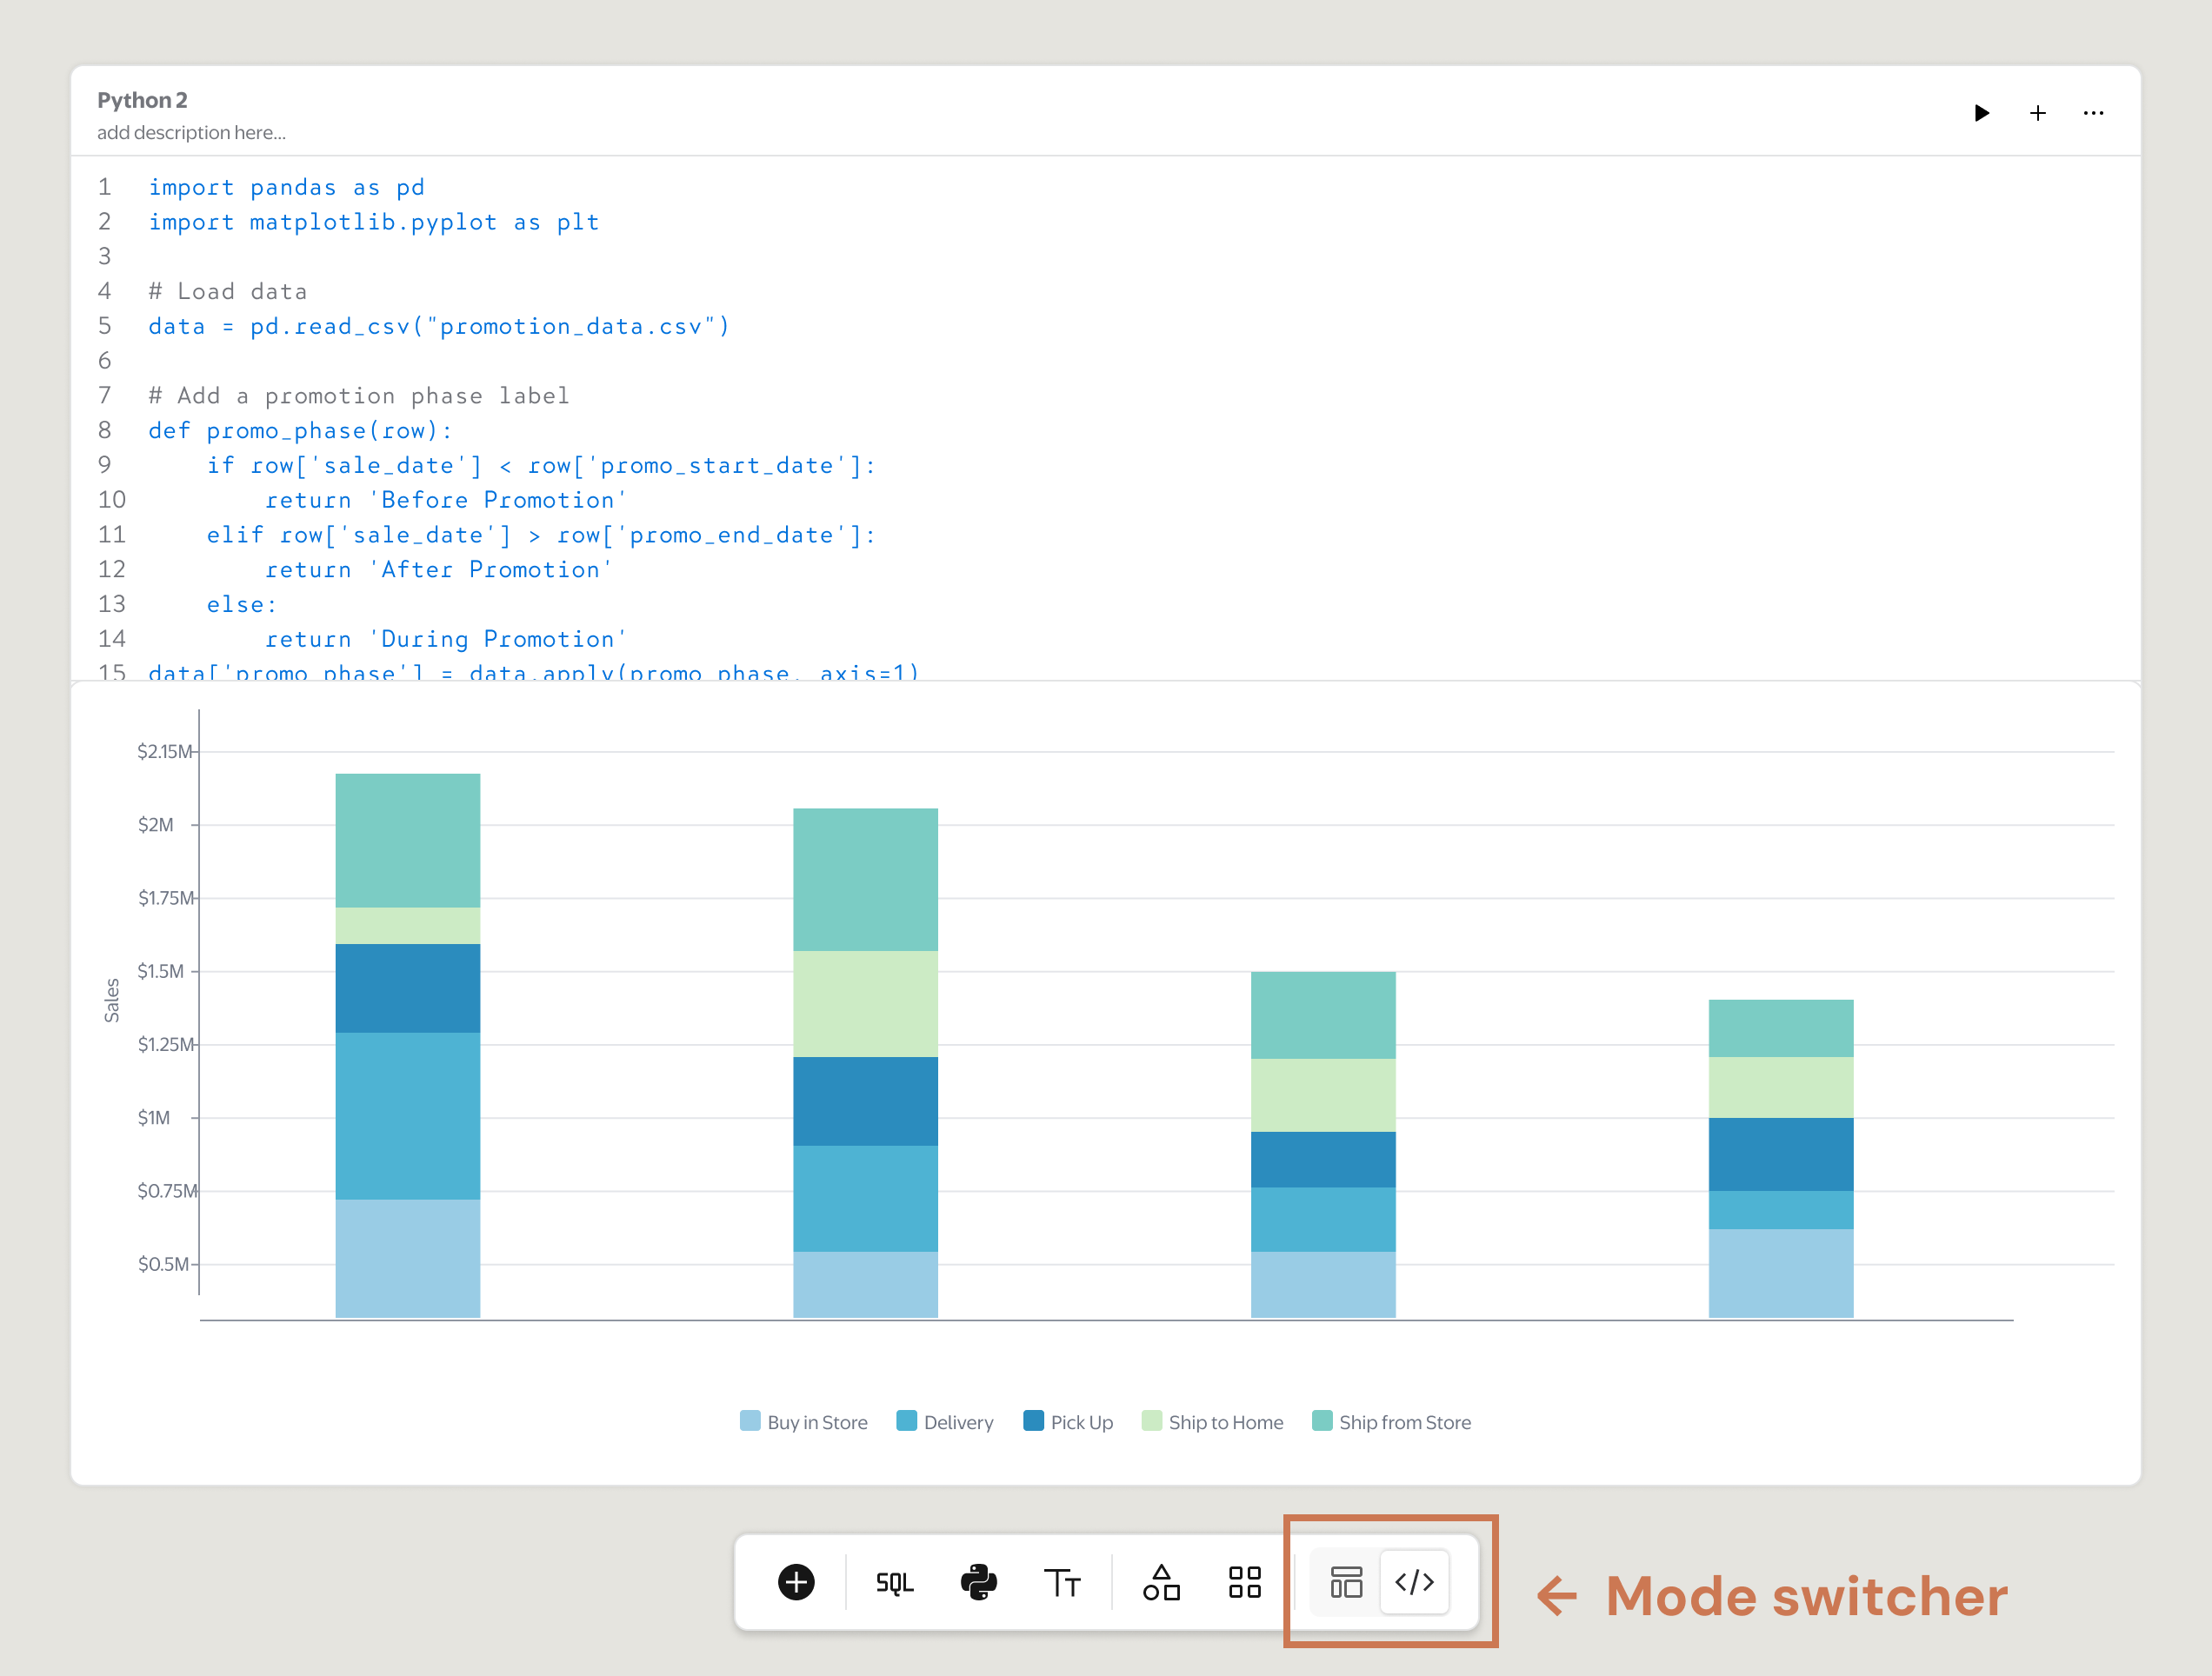
Coding mode
In contrast to above no-code dashboard creation experience, Coding mode gives technical users the flexibility to pull data through SQL, and visualize the data in Python.
Of course, they can always switch back to no-code mode via the mode switcher in the tool bar.
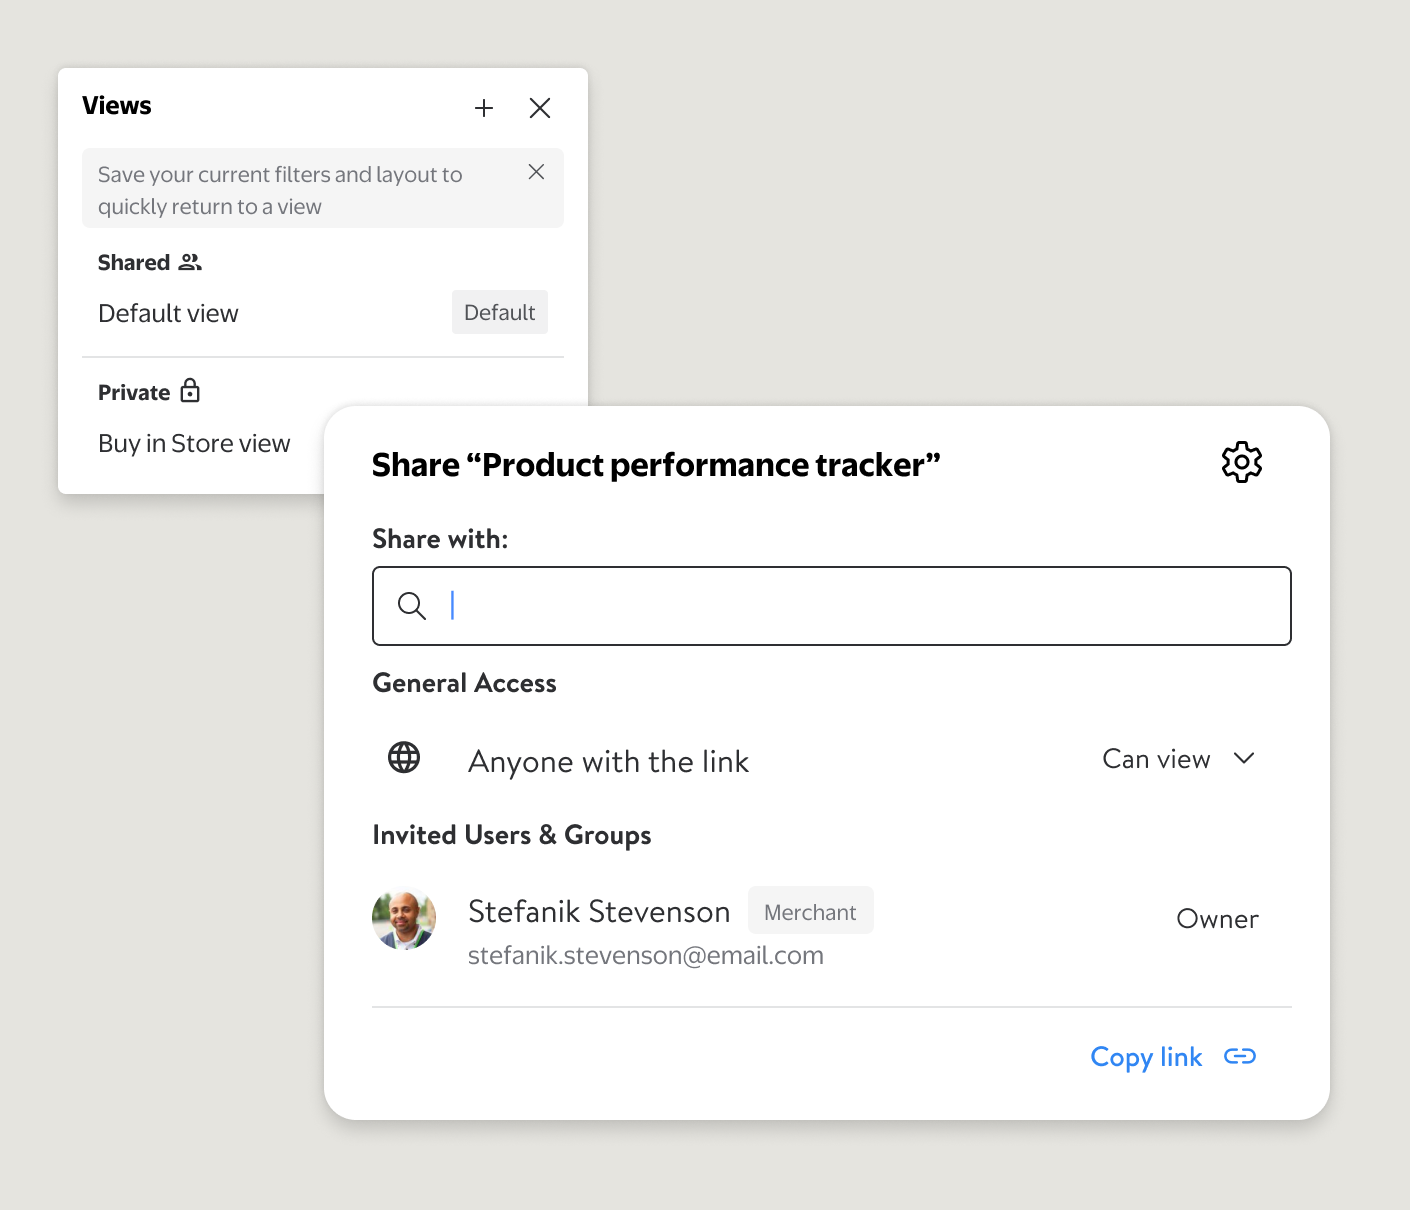
Sharing & Views
Dashboards can be shared across the organization. Owners and recipients can apply different filters and create saved views for flexible dashboard experiences.
Complementary systems
A dashboarding system alone wasn’t enough to deliver a full suite-like experience. To support end-to-end workflows, we designed complementary systems such as a template library, workspaces, and global search, foundational elements that make the platform more scalable, flexible, and cohesive.
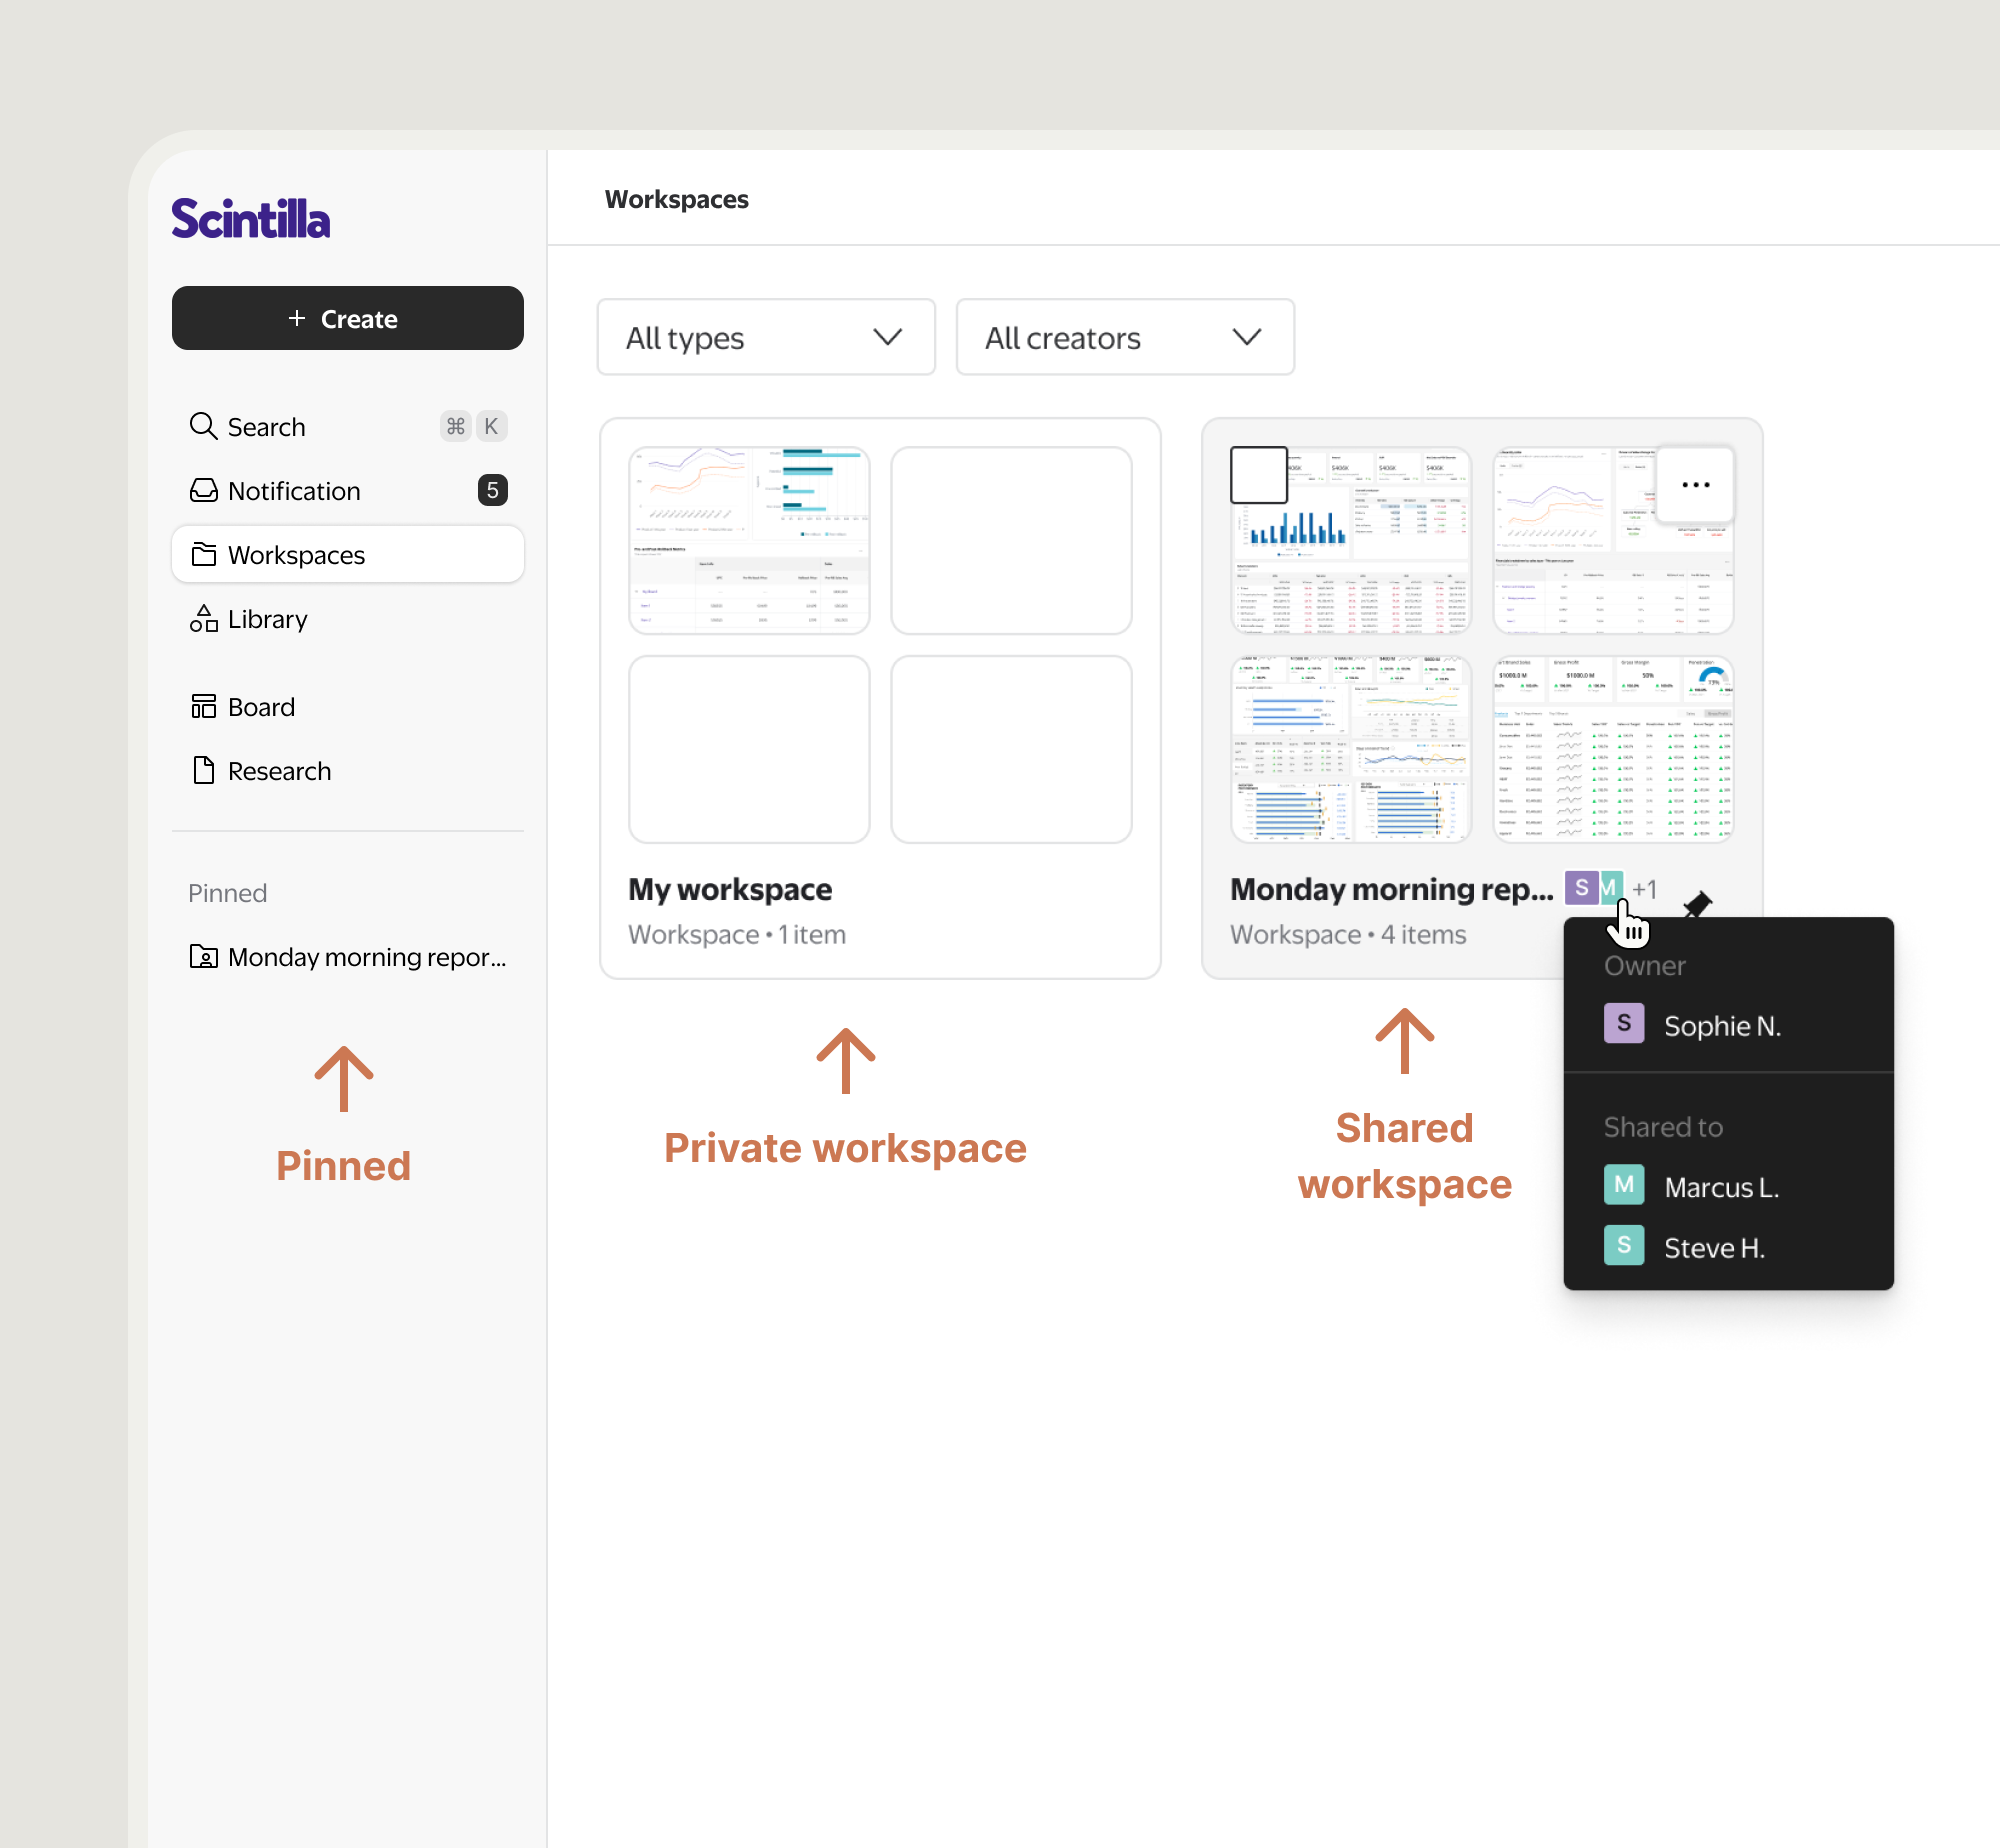
Workspaces
Collaborative spaces for teams to organize dashboards, helping users manage private and shared views while keeping projects aligned.
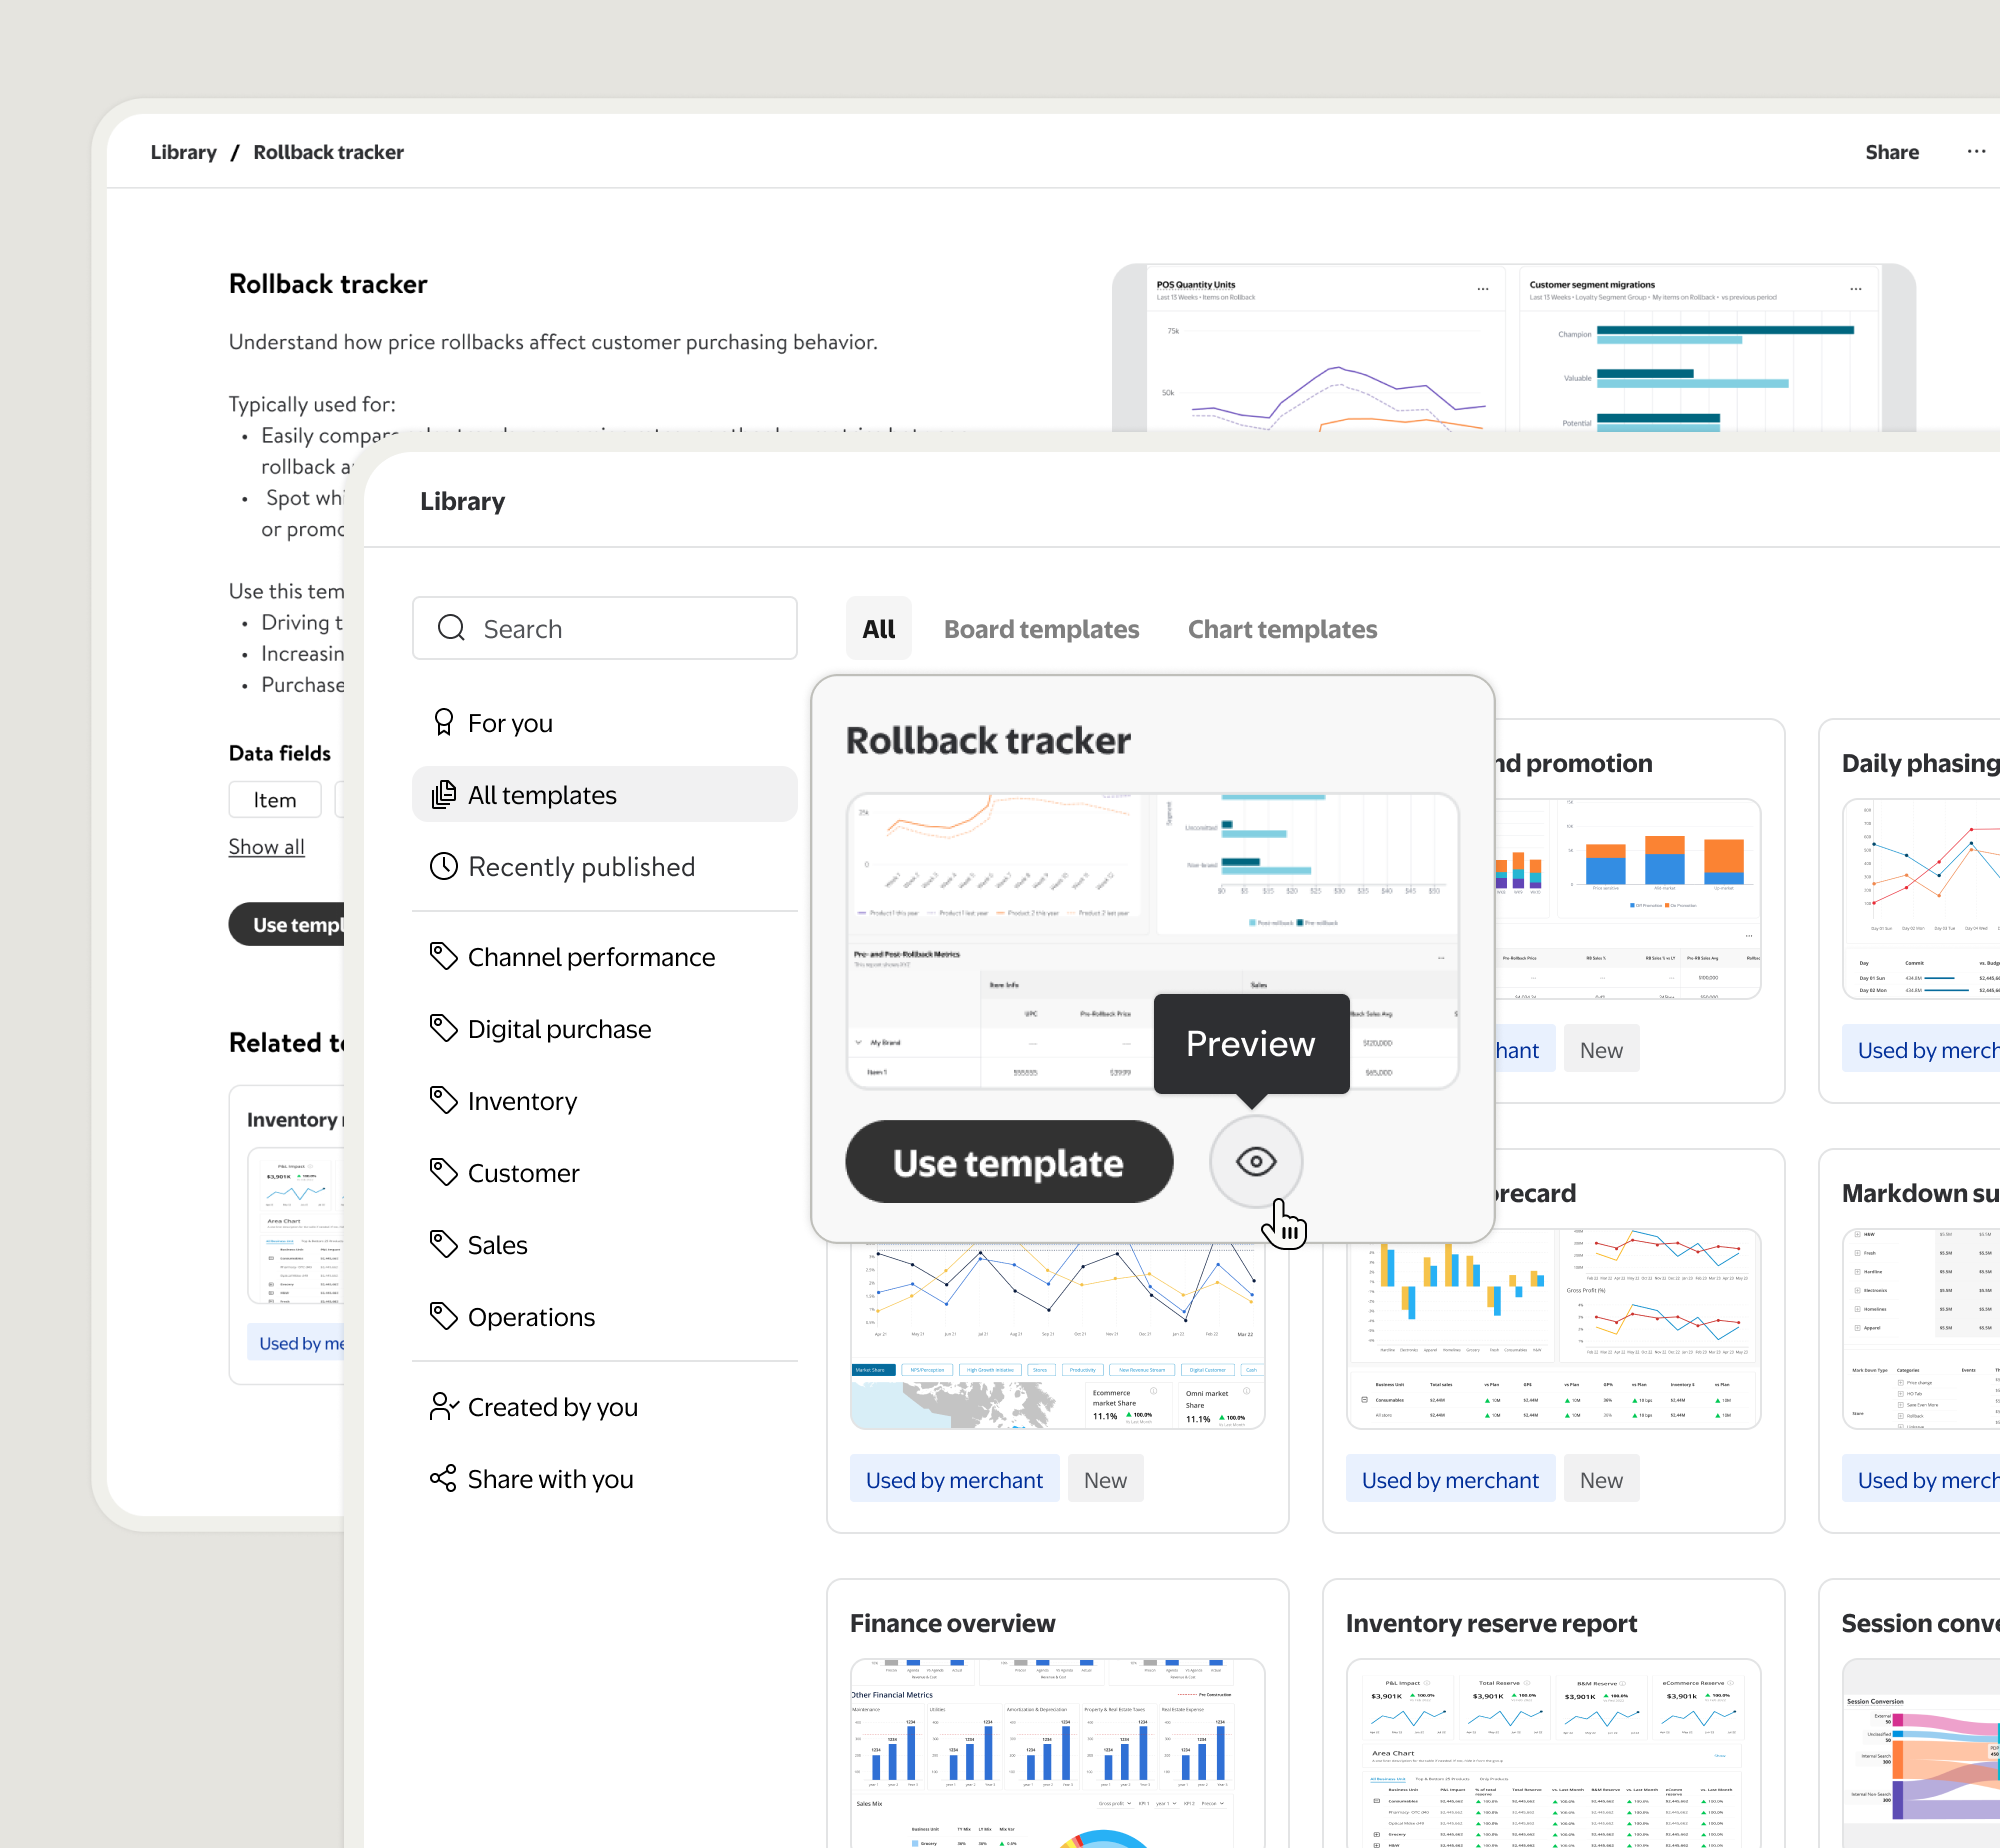
Library
A centralized hub for pre-built dashboards based on common use cases, helping users quickly start building dashboards and getting to insights faster.
Global search
An AI-powered search experience that brings all assets together, helping users easily discover dashboards, templates, and metrics across the platform.
Result and Impact
All 30+ users interviewed found the system significantly easier to use than the current product. Average ease-of-use rating is 7.8/10.
100% buy in from leadership (VP of Data Ventures and Head of all cross functional teams), and the Northstar direction drove a product team re-org and business pivot.
🗣️ Let’s hear what our users said during the testings...
Please reach out if you'd like to learn more
Scintilla - Retail analytics platform
In early 2025, I took on the lead design role for Scintilla 2.0, Walmart’s new flagship retail analytics platform. My first responsibility was to define the North Star vision for the entire data suite, setting a clear direction for how the platform should evolve. I shaped a unified experience that empowers Suppliers and Merchants to seamlessly turn insights into action, establishing the foundation and roadmap that will guide Data Ventures for the next three years.
Role
Design lead
Timeline
Dec 24’ - May 25’
Contribution
Design, Research, Strategy, Stakeholder management
Team
1 Designer, 1 Researcher, 1 PM

Core system- Dashboard builder
The foundation of Scintilla 2.0 is a flexible dashboarding system that empowers both technical and non-technical users to create, customize, and share insights. It also provides a framework for scaling reusable templates, making it easier to stand up new solutions quickly.
Dashboard canvas
Reimagine how reports are created and data is consumed.
The solution is designed for all user types, from data specialists to non-technical users, allowing seamless switching between no-code and coding modes.
Data viz module
Building blocks for user to assemble dashboards and visualize their data.
Visual type
Data can be visualized in the formats that can best present the insights.
From user interviews, we identified the five visualization types most commonly used in Supplier dashboards today.
Coding mode
Different from the no-code dashboard creation experience, Coding Mode empowers technical users to work directly with SQL for data retrieval and Python for visualization. For flexibility, users can switch back to No-code Mode anytime using the toolbar mode switcher.
Sharing & Views
Dashboards can be shared across the organization. Owners and recipients can apply different filters and create saved views for flexible dashboard experiences.
Complementary systems
A dashboarding system alone wasn’t enough to deliver a full suite-like experience. To support end-to-end workflows, we designed complementary systems such as a template library, workspaces, and global search, foundational elements that make the platform more scalable, flexible, and cohesive.
Workspaces
Collaborative spaces for teams to organize dashboards, helping users manage private and shared views while keeping projects aligned.
Library
A centralized hub for pre-built dashboards based on common use cases, helping users quickly start building dashboards and getting to insights faster.
Global search
An AI-powered search experience that brings all assets together, helping users easily discover dashboards, templates, and metrics across the platform.
Result and Impact
All 30+ users interviewed found the system significantly easier to use than the current product. Average ease-of-use rating is 7.8/10.
100% buy in from leadership (VP of Data Ventures and Head of all cross functional teams), and the Northstar direction drove a product team re-org and business pivot.
🗣️ Let’s hear what our users said during the testings...
Please reach out for full case study